Mapbox Vector Terrain, our global elevation and landcover tiles whose data drives maps like Outdoors, is getting a resolution bump as we use our declouded satellite imagery to improve land cover designations worldwide. With a clear view of the ground and the 11 bands that Landsat 8 has to work with, we’re able to identify unique land cover classes ranging from slight vegetation changes to more dramatic differences between the built and natural environments. An increased resolution of up to 10x means more detailed styling and informative location data for all of your applications.
More detail in natural landscapes
The variation in natural landscapes relates to the real world in much finer detail with a resolution improvement of 300 meters to 30 meters in certain places.
More detail in built environments
Our land cover data over many urban areas has improved dramatically. With algorithmic recognition of parks, small water bodies, and other designations between the natural and built environment, your applications will have improved user experience at every step.
We’re so excited to welcome Benjamin Tran Dinh to Mapbox! Benjamin is joining our telemetry team to analyze sensor data and help us build maps and new products for guiding semi-autonomous vehicles as part of Mapbox Drive.
Previously, Benjamin was at Exonav, building a navigation map for autonomous vehicles. Before joining Exonav, he received his masters from Ecole des Ponts ParisTech in Industrial Engineering, with a specialization in Operations Research and Innovation Management.
Join us in welcoming Colleen McGinnis to the Mapbox team! Colleen is jumping aboard the Mapbox support team, where she’ll be putting her development and design skills to work to help Mapbox users get the most out of our tools. Keep an eye out for Colleen’s work in our help pages, on the blog, and anywhere you go for Mapbox guidance!
Before joining Mapbox, Colleen worked for a non-profit where she created tools and programs to reduce environmental impacts. She holds a master’s degree in sustainable design from the University of Texas at Austin and a dual degree in architecture and environmental science from Miami University.
Last Friday, we got together over tri-tips, drinks and corn on the cob for team BBQs in Ayacucho, Bangalore and San Francisco. Tomorrow, the DC team and friends will host the last Mapbox BBQ of the season. Stop by the Garage for some half-smokes and cornhole, and check out highlights from the Bangalore and San Francisco BBQs.
La semana pasada, el equipo de Mapbox Perú organizó un evento de Mapillary en Ayacucho como parte del esfuerzo de hacer que Huamanga, Perú sea la ciudad mejor mapeada en América Latina. Cada miembro del equipo participó con mucho entusiasmo, recorriendo las principales calles de la ciudad de Huamanga utilizando celulares y tabletas para capturar las imágenes. Las modalidades de recorrido fueron caminando, en bicicleta y en auto.
Hicimos el recorrido de 11 am a 2 pm para asegurar la calidad de nuestras fotos, de tal manera que el sol estuviera en su punto máximo y no proyectara sombras al momento de tomar las fotos.
Para el recorrido en auto fue necesario adecuar soportes para 3 celulares por delante del parabrisas y 2 tabletas en la parte superior del auto. Toda la adecuación tomó menos de 1 hora. Hicimos el recorrido en auto a una velocidad de 20 km por hora, logrando de esta manera capturar la mayor cantidad de imágenes.
Tomamos un total de 8,159 fotos durante todo el recorrido y seleccionamos las mejores fotos entre estas para subir a Mapillary.
Mapillary event Ayacucho
The last week, Mapbox Peru led a Mapillary event in Ayacucho as part of our efforts to make Huamanga, Peru the best-mapped city in Latin America. We covered the route by walking, biking, and driving through the main streets of Huamanga.
We took photos on our cell phones and tablets from 11 am to 2 pm, making sure the sun was at its peak and reducing the chance of shadows in the images.
For those driving, we set up three cell phones in front of the car windshield and two tablets on top of the car. The entire set up took under an hour. We drove at 20 km per hour to capture the terrain in detail.
The team took a total of 8,159 photos of the route and uploaded the best photos to Mapillary.
Mapbox is continuously contributing high-quality data to OpenStreetMap, and we are currently working closely with the community on navigational mapping projects. Along with improving data on OpenStreetMap, we also validate data on OpenStreetMap regularly to check for invalid edits and to keep OpenStreetMap free from vandalism.
OpenStreetMap is a huge open geospatial data pool which is updated every day, is accessible for free and used as a basis for many studies and research projects.
We are excited to welcome Rasagy Sharma to Mapbox! Rasagy joins our design team based out of our Bengaluru office, working on custom cartography, data visualizations and improving the user experience across the open mapping tools that is used by the data team to improve OpenStreetMap every day.
A graduate of information design from the National Institute of Design Bangalore, Rasagy was previously a UX designer working on financial technology applications at Barclays and using much of his spare time exploring how design can make the world a better place.
This is a big week in East Africa for open data and the Sustainable Development Goals.
Our good friends Map Kibera are sharing their work on open, community based mapping at the Kenya National Roadmap Workshop, where government, NGOs and companies are gathering to work more closely toward a SDG monitoring plan. Then at the East Africa Open Data Festival on Wednesday and Thursday, participants will explore how open data can be a key platform for both monitoring and meeting the SDGs. Join Josh Ogure and Zach Wambua to learn hands-on how open mapping can help address the world’s toughest development problems.
We came up with a neat little algorithm that may be useful for placing labels and tooltips on polygons, accompanied by a JavaScript library. It’s now going to be used in Mapbox GL and Mapbox Studio. Let’s see how it works.
The problem
The best place to put a text label or a tooltip on a polygon is usually located somewhere in its “visual center,” a point inside a polygon with as much space as possible around it.
The first thing that comes to mind for calculating such a center is the polygon centroid. You can calculate polygon centroids with a simple and fast formula, but if the shape is concave or has a hole, the point can fall outside of the shape.
How do we define the point we need? A more reliable definition is the pole of inaccessibility or largest inscribed circle: the point within a polygon that is farthest from an edge.
Unfortunately, calculating the pole of inaccessibility is both complex and slow. The published solutions to the problem require either Constrained Delaunay Triangulation or computing a straight skeleton as preprocessing steps – both of which are slow and error-prone.
For our use case, we don’t need an exact solution– we’re willing to trade some precision to get more speed. When we’re placing a label on a map, it’s more important for it to be computed in milliseconds than to be mathematically perfect. So we’ve created a new heuristic algorithm for this problem.
Probe the polygon with points placed on an arbitrarily sized grid (24x24 in the paper, or 576 points) distributed within its bounding box, discarding all points that lie outside the polygon.
Calculate the distance from each point to the polygon and pick the point with the longest distance.
Repeat the steps above but with a smaller grid centered on this point (smaller by an arbitrary factor of 1.414).
The algorithm runs many times until the search area is small enough for the precision we want.
There are two issues with this algorithm:
It isn’t guaranteed to find a good solution and depends on chance and relatively well-shaped polygons.
It is slow on bigger polygons because of so many point checks. For every blue dot in the image above, you have to loop through all polygon points.
However, taking this idea as an inspiration, we managed to design a new algorithm that fixes both flaws.
The new solution
We needed to design an algorithm that would not rely on arbitrary constants, and would do an exhaustive search of the whole polygon with reliably increasing precision. And one familiar concept struck as immediately relevant to the task – quadtrees.
The main concept of a quadtree is to recursively subdivide a two-dimensional space into four quadrants. This is used in many applications – not only spatial indexing, but also image compression, and even physical simulation, where adaptive precision which increases in particular areas of interest is beneficial.
Here’s how we can apply quadtree partitioning to the problem of finding a pole of inaccessibility.
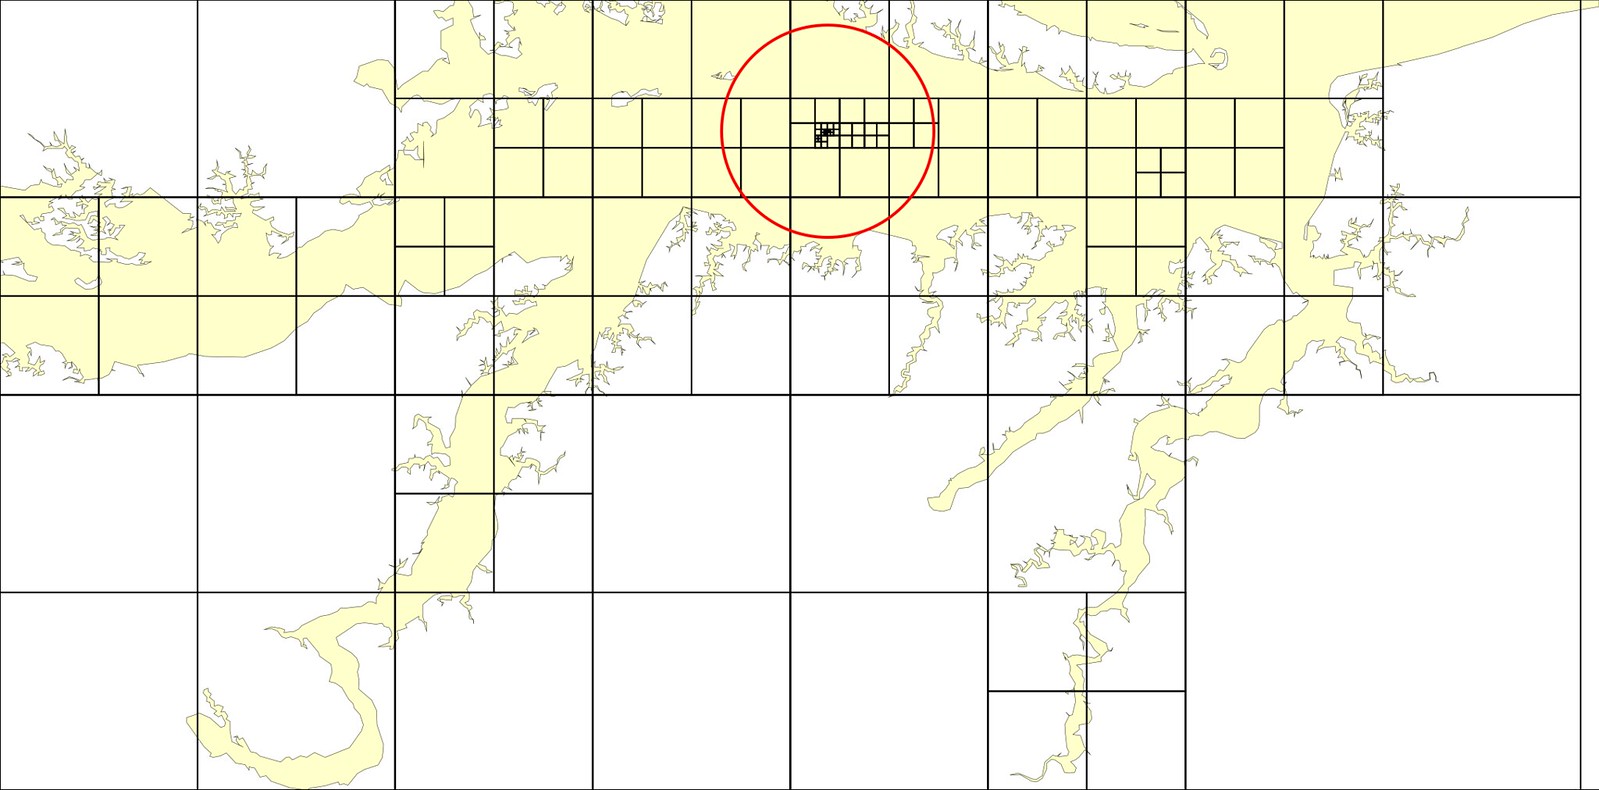
Start with a few large cells covering the polygon.
Recursively subdivide them into four smaller cells, probing cell centers as candidates and discarding cells that can’t possibly contain a solution better than the one we already found.
Since the search is exhaustive, we will eventually find a cell that’s guaranteed to be within a global optimum.
How do we know if a cell can be discarded? Let’s consider a sample square cell over a polygon:
If we know the distance from the cell center to the polygon (dist above), any point inside the cell can’t have a bigger distance to the polygon than dist + radius, where radius is the radius of the cell. If that potential cell maximum is smaller than or equal to the best distance of a cell we already processed (within a given precision), we can safely discard the cell.
For this assumption to work correctly for any cell regardless whether their center is inside the polygon or not, we need to use signed distance to polygon – positive if a point is inside the polygon and negative if it’s outside.
Finding solutions faster
The earlier we find a “good” cell, far away from the edge of the polygon, the more cells we’ll discard during the run, and the faster the search will be. How do we find good cells faster?
We decided to try another idea. Instead of a breadth-first search, iteratively going from bigger cells to smaller ones, we started managing cells in a priority queue, sorted by the cell “potential”: dist + radius. This way, cells are processed in the order of their potential. This roughly doubled the performance of the algorithm.
Another speedup we can get is taking polygon centroid as the first “best guess” so that we can discard all cells that are worse. This improves performance for relatively regular-shaped polygons.
Summary
The result is Polylabel, a fast and precise JavaScript module for finding good points to place a label on a polygon. It is up to 40 times faster than the algorithm we started with, while also guaranteeing the correct result in all cases.
It’s now being ported to C++ and incorporated into both Mapbox GL JS and Native. The module is just 100 lines of code, so check it out!
Our iOS SDK includes basic support for VoiceOver, the screenreader that comes with every iPhone and iPad. Now, users with visual impairments have the same access as sighted users to the information contained in map markers and callout views.
An invisible map
VoiceOver is integrated deeply into the operating system, and support for it is pervasive across Apple’s first-party applications. Visually impaired users expect third-party applications to make their entire interfaces accessible as well, and Apple even promotes such applications on the App Store.
It’s easy to overlook the importance of making a map fully accessible to screenreaders. After all, an image inside your application is best narrated as a single interface element; in general, it would be tedious to treat each region of the image as its own interface element. Some leading navigation applications on iOS take this approach to accessibility. For example, much of the Google Maps interface can be heard in this sound recording, but there’s something missing:
In a video of the same scenario, notice how the focus rectangle skips past the map’s content – the user location marker and search result pin – as though the map doesn’t really exist:
A map view isn’t an ordinary image: like an ordinary table view, it contains meaningful data. In order to take full advantage of your application, a visually impaired user needs to be able to navigate among the markers on the map and hear their names read aloud.
Batteries included
To be sure, points of interest are surfaced in tabular form in Google Maps’s search results. But if you’re developing your own application using the Google Maps SDK, you have to do extra work to build an alternative textual UI. Otherwise, the data represented by these map markers is completely inaccessible to VoiceOver users.
Our iOS SDK integrates directly with VoiceOver: for the most common use cases, you only have to write your interface once and it’ll work intuitively with the screenreader turned on, without any additional work on your part. VoiceOver lets the user navigate among various map controls, including the compass and user location annotation, and reads aloud the name of each pin on the map. For all your users, the map behaves as expected without any impact on performance.
If you want more control over what VoiceOver users hear, you can implement the standard UIAccessibility methods on your annotation views or use feature querying to read aloud elements of the base map, such as street names or points of interest.
Beyond accessibility, our SDK’s tight integration with the platform benefits you in numerous other ways, from fitting into your workflow and language choices at design time to maximizing performance at runtime.
Automatic’s app lets you scroll through all your recent trips or dive into individual trip details:
Once you’re set up with Automatic Pro, you can easily connect your car with all the apps on the Automatic platform. Get reimbursed for miles with Expensify and Xero, ask Amazon Echo how much gas you have left in your tank, find parking with Spot Angels, and get your friends to chip in for rides with UnMooch.
Vladimir Agafonkin (@mourner), Johan Uhle
(@freenerd), and
I (@sgillies) will be in Bonn, Germany next
week for FOSS4G. We’re excited to meet
you there to discuss WebGL, vector tiles, routing, and standards.
Check out the full program next week for room information.
I’ll be at the sprints on Monday and Tuesday before the conference to work on Rasterio and GDAL and learn more about other projects. Hope to see you then!
We’re thrilled to welcome the incredible team behind Human to Mapbox!
Our shared vision of changing the way people move around cities and understand our planet is what makes this so special. I fell in love with the product design immediately - then liked how the app looked at my daily activity in real-time and tracked the pulse of whatever city I was in. As our teams became friends, working together in our open source mobile repositories, it was clear that we should be working a lot closer.
What the Human team has built is nothing short of amazing - their data visualizations and maps showcase its global pool of Human activity. This perspective on data is clutch as we expand our mobile play and turn anonymized aggregated data into a real-time updating map.
We’re now processing more than half a billion miles of anonymized aggregated data a week. From knowing where it’s safe to bike to real-time traffic, we’re building a truly self-healing map, adapting as the world changes. The network effect is beautiful - as more developers install our SDK our maps are used more. And then the anonymized aggregated data from those users make the map better and in turn, more developers want to install the SDK to have the best maps.
Human will continue to operate as a standalone activity app. We love it and love the community. The app is now shipping with frequent updates of our SDK, letting us showcase the latest features of Mapbox’s mobile SDKs and radically accelerate our SDK development.
It’s an absolute honor to welcome Christina, Fredrik, Ivo, Laurier, and Paul to the team.
Recent imagery can not only help you add latest features on OpenStreetMap, but also verify if the older map data still resembles what’s on the ground or not. Our friends at the World Bank are working in Cần Thơ, in the Mekong Delta of Vietnam, to manage and reduce flood risk around the city. The importance of recent imagery and map data comes into play as authorities try to anticipate the connectivity of urban areas vulnerable to a rise in the Hậu River’s water level.
An older bridge which is no longer on the river.
Untraced features on OpenStreetMap due to old and unclear imagery.
We partnered with parking mapping company Spot Angels to visualize its street level data with Mapbox GL JS. We took a sample dataset of Detroit, MI and set up a time-series animation of the various parking regulations across the city.
Mapbox maps allow the team at Spot Angels to dynamically visualize their data in real time in order to efficiently help their users avoid the typical hassles of finding a spot in a crowded city.
This week Mapbox will be at the DC Android Summit, a two-day multi-track event focused on designing, developing, and testing for Android. Look out for my talk, Build Your Own Ride Sharing App on Android, in the development track on Friday at 2:30 pm.
In my talk, I’ll review frequent UI interactions present in popular ride sharing apps and show you how to build them using our open source SDKs in ways that are both idiomatic and performant. I’ll also cover Mapbox Drive, our latest Android SDK, and Mapbox Android Services.
We’re thrilled to welcome Kara Mahoney to Mapbox! Kara is joining us in DC to work on security, data pipelines, and preparing our APIs for offline and specialized deployments.
Before joining Mapbox, Kara created an open source search and rescue (SAR) mapping application with local DC start up Azimuth1, using OpenStreetMap data and Mapbox GL styles to create better topographical SAR maps. She holds a bachelor’s degree in geography from George Mason University.
We use React to build Mapbox Studio, demos, and many other parts of our website. React, along with Redux, and Immutable.js, forms a new standard for building web applications that yields good and robust results.
Reactive-style display
A trademark of the React way of doing things, as well as its alternatives like virtual-dom, cycle.js, or deku, is that you define the HTML you want for each state of your application and then trust the library to efficiently make that the truth. For instance, in the canonical ‘timer’ example:
If you were using jQuery, you’d probably render the initial page from a template or static file, and then reach into the page to modify the number of seconds elapsed:
$('#seconds-elapsed').text(secondsElapsed);
Here, you, the human, are optimizing. You know that the rest of the page stays the same - the div element, the other text - so you’re only changing part of it.
In the React version, React does this optimization. It decides which parts of your page stay the same and which change, and it figures out the most efficient way to go from A to B. If your render method describes a page with a red button and then you run render again and the button is now declared to be blue, React will try to find the minimum number of steps to go from one to the other. It won’t use .innerHTML to replace the whole page, and it might not even need to replace the button element - simply adding a class or style property might do the job.
So we’re replacing imperative methods like .text() or .setAttribute() with a full description of ‘what we want the UI to be,’ as decided by the render() method. This way React components don’t need to respond to any data changes in particular: there are no piecemeal changes to the page because an input was toggled. Instead, every change can be thought of a ‘render from scratch’, but the system ensures re-renders will be fast.
Mapbox GL JS
How can Mapbox GL JS fit into a reactive-style system like React.js?
The React/Redux system works perfectly for a tool like Mapbox Studio: it deals with complex, interconnected data - map styles and features - and complex interactions. A color change on the map might come from someone typing a new color manually, or from a click on a color picker, or even from someone hitting “Undo” and “Redo.” For the tool to be immersive, all of these changes need to be fast and smooth.
But Mapbox GL JS’s APIs were very low-level and imperative. Calling setStyle()replaced a complete style from scratch, causing an unpleasant flash. We could call other methods, like setPaintProperty, to make incremental and fast changes to certain parts of the style, but this connects specific UI actions with UI reactions, which cuts against our intent and makes the application brittle.
We decided that we wanted the equivalent of React’s render() call: a single method that you can call with a complete map style and that intelligently transitions from its current state to the new one. So we ended up writing a “diff” algorithm that started in Studio and ended up in mapbox-gl-style-spec: diffStyles. How it works is that you give it two Mapbox GL styles, and it returns an array of commands like:
Applying these changes is pretty simple: each command is a method on the map object, and we can use JavaScript’s Function.prototype.apply method to call it with any number of arguments, stored in args.
When we started, there weren’t efficient functions for many of these changes, but we’ve rallied for more and more low-level APIs in Mapbox GL JS and come up with a good experience. There are still missing links - sprites, for instance, can’t be modified programmatically. When there’s no efficient way to turn one style into another, we fall back on a setStyle call.
With this system in place, we manage the stylesheet entirely within a Redux reducer, and within an immutable data structure with Immutable.js. As a result, we can easily show and control values of every property in the stylesheet. We then treat the map as only an output mechanism, never storage for the style. We set the map’s style, but never refer back to it, or use any getter methods.
Events
That’s how we do style updates in Mapbox Studio. “One true way to render” is a big part of the reactive philosophy. Let’s cover another one: events.
Since React manages user-initiated events, you can add event listeners like:
Importantly, when the value of this.state.text changes, React updates it in that text input, but doesn’t call this.onChange. This breaks the potentially infinitely recursive loop that happens when your program responds to its own output.
Initially, this was a problem with Mapbox GL JS. We have many ways of controlling the map - through keybindings, the geocoder, saved initial map position, text inputs, and mouse control - as well as ways of displaying it, mainly in the map controls user interface element. Controlling the map by moving it with a function like jumpTo also fires events like move, and we would react to those events by updating the position of the map in our Redux reducers, and disaster ensued.
Luckily, this issue could be avoided by a small improvement to the Mapbox GL JS API. Bryan contributed a change that adds a .originalEvent property to user-initiated events. So to only subscribe to move events caused by humans, you can write:
map.on('move',function(event){if(event.originalEvent){console.log('A human moved the map');}});
This way we disconnect the accidental recursive loop and we can store the map’s zoom, latitude, and longitude in a reducer.
Thanks to the diffStyles method, our integration between Mapbox GL JS and Mapbox Studio doesn’t need a module or strong abstraction: we can interact with the low-level parts of Mapbox GL JS if we need to. With a few good patterns in place, Mapbox GL JS flows beautifully into the rest of a modern, reactive application.
Today we are opening up access for all users to the Mapbox Studio dataset editor, a brand new tool for creating and editing geospatial data in your browser. The dataset editor integrates seamlessly with the existing style editor to round out your mapping workflow: upload and edit data, customize your map style, and publish your map for web and mobile, all with Mapbox.
Create maps for your specific needs
Seattle University campus map for print and web created with the Mapbox Studio dataset editor.
Use the point, line, and polygon editing tools to add extra context to the parts of the map that matter most:
Use the dataset editor to import and trace your own source imagery. Import drone photography, historical maps, or even fantasy maps:
Tracing historical imagery of the Boston coastline to use in an interactive visualization.
Add points to the map based on search results with one click:
Drag and drop CSV or GeoJSON files into the dataset editor and see your data appear on the map. Once you import your data, you can quickly search through and modify features:
Visualize your datasets
A fire tracker app that uses datasets to visualize burn areas.
Export any dataset to a tileset, then visualize your data with the Mapbox Studio style editor:
Modify with the Datasets API (coming soon)
The dataset editor runs on top of the Mapbox Datasets API, which is currently available for preview. The Datasets API allows developers to create, edit, and update datasets programmatically. Use the API to build continuously updating visualizations or to power the location data in your next app.


 An older bridge which is no longer on the river.
 Untraced features on OpenStreetMap due to old and unclear imagery.


