Here’s a rundown of the new plugin now available in Power BI:
Customizable visualizations
Use the plugin to explore your data as interactive heatmaps, graduated circles, or clusters. Add multiple data visualization layers to the same map and change visibility based on zoom.
Fast rendering
Filter and explore tens of thousands of data points with the fastest maps on the market, rendering vector tiles on the client at 60 frames-per-second (the speed of a video game).
Total design control
Add any of eight Mapbox map styles tailored for data visualization directly in Power BI, including high-resolution satellite, terrain, and traffic. Build a custom map style in Studio, and import it into your dashboard with one click.
Cluster by property value
Understand data minimums/maximums, sums, and averages with property aggregation for clustering. For example, find the maximum earthquake magnitude by region and month in 2017, not just earthquake density.
Import custom data
Upload massive point, line, or polygon datasets in CSV, Shapefile, KML, GeoJSON, or GeoTIFF format. Add the data to your dashboard as a custom map style, such as a shapefile of neighborhood boundaries and names in New York City.
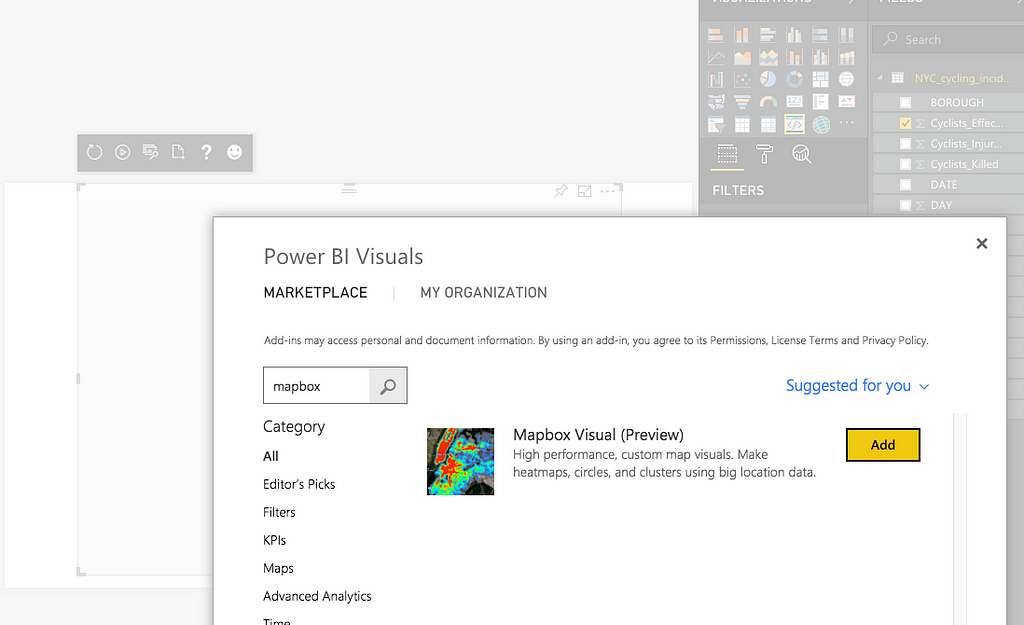
Getting started
To use the Mapbox Visual for Power BI, you’ll need a Mapbox account and a Power BI Desktop account. Grab the Mapbox Visual for Power BI from the Microsoft Office Store or directly from your Power BI dashboard. Just click add from marketplace and search Mapbox.
For full step-by-step instructions, including getting started with the plugin, check out this tutorial.
Are you a business intelligence developer? The Mapbox Visual for Power BI is open-source on GitHub. Pull requests and issue tickets for bugs and features are welcome.
What’s next?
Send us a tweet @Mapbox to show us what you build. If you want to extend the visual in a custom Power BI implementation, drop us a line or add a feature request on the project’s open-source GitHub repository.
Parallel specializes in mapping and data visualization with a focus on the UK healthcare sector. They use Studio and GL JS to render data-heavy map tiles, style basemaps and data overlays, and add interactivity to maps. Ashley Clough, founder of Parallel, shares some of their recent data explorations with our tools and why he uses our stack:
We love using Mapbox because of its open source ethos, incredible power, and particularly the relentless innovation: extruded 3D polygons — we love making city maps with those; heatmaps — whole new opportunities for massive datasets; GL terrain — an amazing, almost instant update for many of our existing styles. I lurk on Github and Mapbox.com waiting for the next bit of functionality to explore.
1. Heatmap with isochrones for 30,000+ schools across England and Wales
We were looking for an opportunity to use Mapbox GL heatmaps for a large point dataset (neatly processed using Tippecanoe) and link it to the dynamic isochrone generation tool we use. We wanted to give anyone the opportunity to create an isochrone around their local school and explore thousands of other schools.
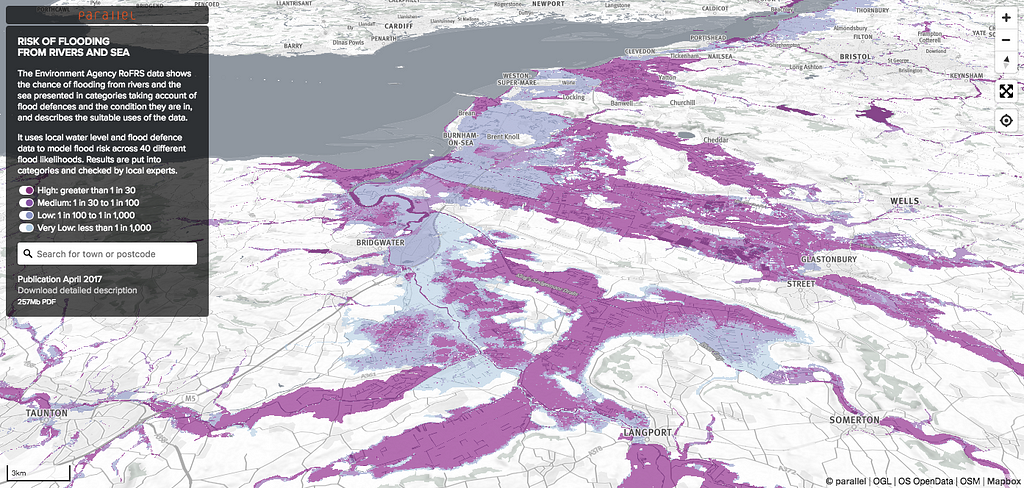
We’ve been processing the UK Environment Agency’s data for several years. The combination of interactive GL maps and the new dynamic, hillshade terrain rendering proved irresistible for presenting the latest variation of flood risk data on one of our OS Open Map Local basemaps.
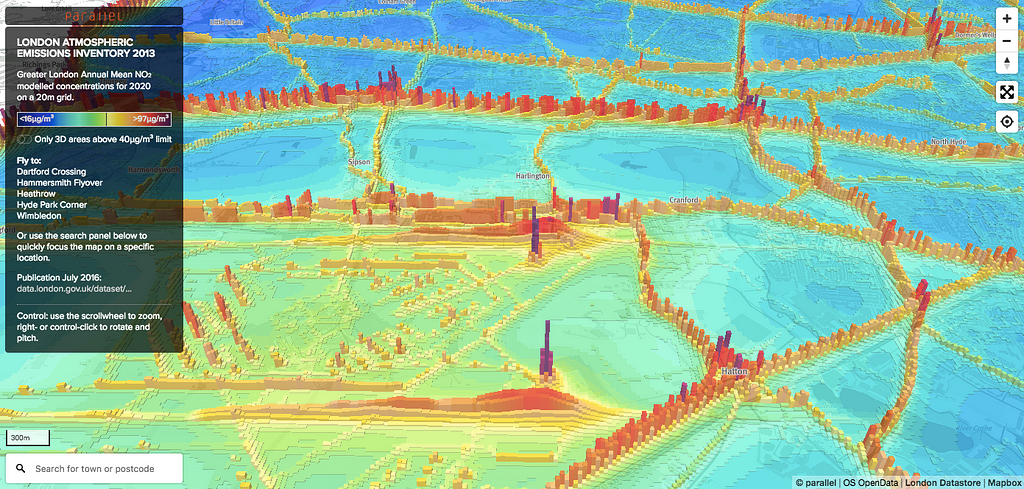
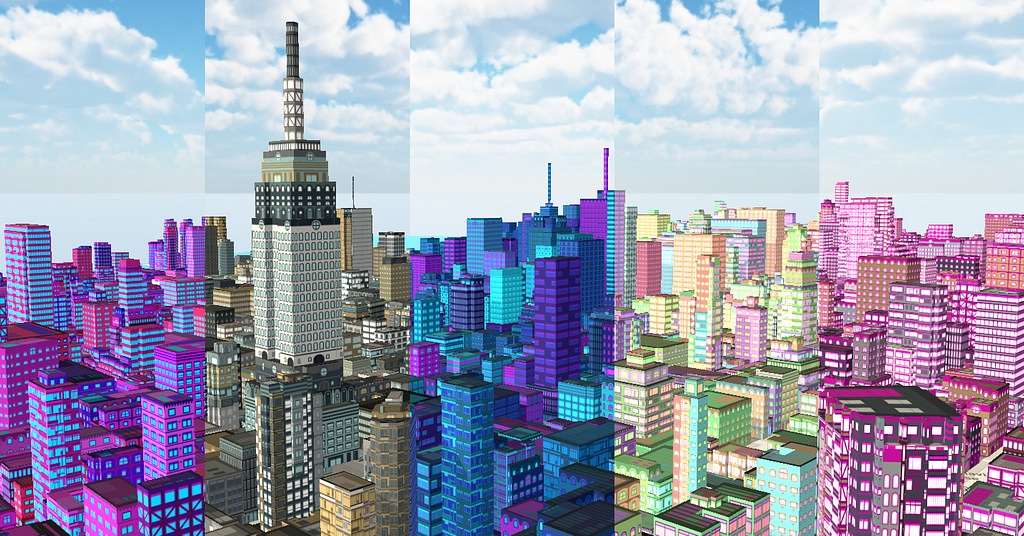
After we’d explored extruding 3D buildings in cities using LIDAR datasets, we thought it would be interesting to try rendering some virtual cities from other interesting datasets. The London air quality data in 2D doesn’t quite show the variation in concentrations across the city, but in 3D, using the extruded polygons in Mapbox GL, the ends of the runways at Heathrow stand out as literal high points.
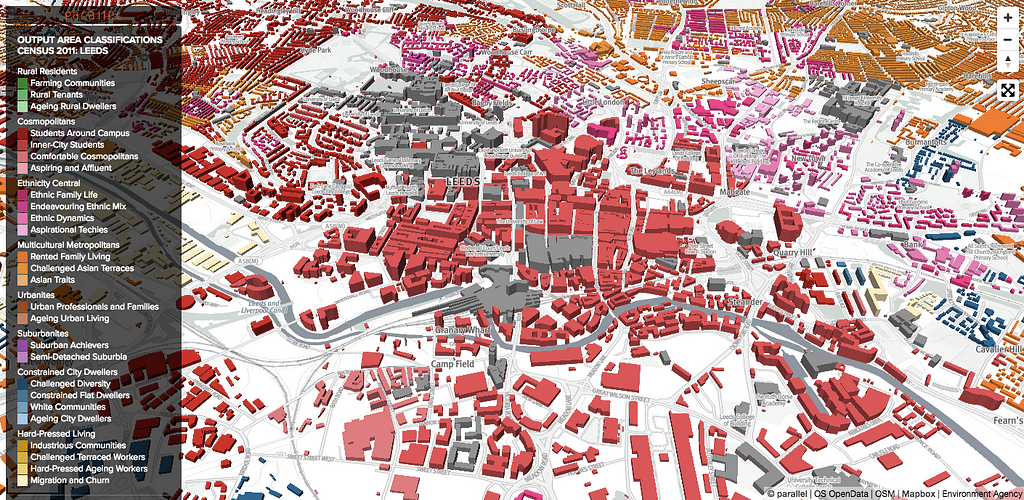
In our home city of Leeds, we’re constantly looking to map local open datasets. This combines national Census data with 3D building heights and locally-modeled building profiles (created in QGIS and stored in a PostGIS database). It allowed us to colour-code most of the city’s buildings and identify the types of people that live in the local areas.
This is another 3D data rendering. With the time series population projection data for the wards in Greater London, we can let the user animate and filter the data over time. The data was processed by PostGIS, output as a tileset in Studio, and then rendered on-the-fly using Mapbox GL JS. Using the web API we can extrude and colour the ward areas based on both the population count and the percentage change from the base year.
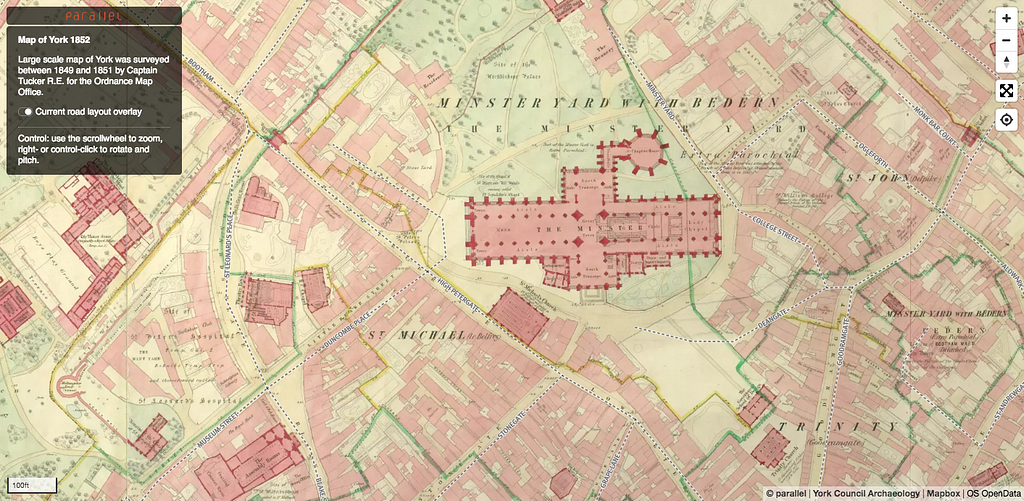
We persuaded the City of York Council to let us have copies of the 15 large, high-resolution scans of the original maps. These were then all stitched together in Photoshop creating an enormous 25k x 23k pixel image that was then georeferenced in QGIS and rasterised in Studio [like this tutorial]. It’s a hefty 3Gb tileset but worth it when you’re walking around the city and the map is updating its location on your mobile phone. Reading the map annotations is made easy by the infinite zooming and rotation capability of the GL API.
Our business intelligence team is in Grapevine, Texas this week at the Gartner Data & Analytics Summit. We’re showcasing some of our favorite implementations using our tools for maps and data visualization, like Geoblink’s cloud-based software for real estate and retail analysis.
The Madrid-based Geoblink team chose to build its software using our location platform because our APIs offer dynamic, data-driven styling with large datasets, rendering fast maps on the client.
Nailing location is critical to businesses that rely on proximity to their customers. For example, gym franchise Anytime Fitness uses Geoblink to determine optimal placement for facilities, analyzing competitor locations, average foot traffic, demographic profiles, total spend per target demographic, and more.
Andy Lee just joined Mapbox to lead our APAC expansion, and his initial focus will be building the team and our operations in China. Andy joins us from Uber where he led business development and corporate development efforts in China and Asia Pacific for the last 3 years.
In his time at Uber, Andy struck a groundbreaking consumer credit card partnership with China Citic Bank, raised hundreds of millions of dollars for Uber China from Guangzhou Automotive and HNA Group, and brought in over $100m in external cost-savings. Prior to Uber, Andy led international expansion for companies including San Francisco-based game maker Kabam and led digital operations and business development at NBA China and News Corporation in China and across Asia Pacific.
From our first conversation it was clear Andy understood location in the local market. He has exactly the type of disruptive background and forward-looking perspective in the space that we need. Andy has lived and worked in China for over 17 years and has led numerous groundbreaking and transformative digital partnerships and mobile product launches for Uber, Kabam, NBA China, and News Corporation — during an era where live streaming, internet video, mobile gaming, and ride sharing came of age. As he comes onboard, he will focus on developing and executing on a strategic plan for our operations in China and the Asia Pacific region and accelerating our efforts to build a world-class team in China.
“I am incredibly honored and excited to join this extremely talented global team and to be charged with building and expanding our China and Asia Pacific business. It was clear when I met Eric that Mapbox is on an amazing growth trajectory and helping developers build the next generation of geospatial and location-based tools and platform to power the next era of mobility. I am also impressed with Mapbox’s commitment to a diverse but inclusive culture, and I am committed to carrying this forward across the region.” — Andy Lee
Andy joins a truly amazing team of senior leaders in Xinnong Yang and Karen Zhang who have enabled us to build a business in cooperation with local partners in one of the most challenging business environments. Xinnong’s expertise in partnerships and the location industry in China is what enabled us to break through, and he is crucial to our ongoing success in-country. Xinnong will work alongside both Andy and me as Director of Partnerships & Strategy, China while Karen — a master of telling our story and managing key relationships — will lead our marketing efforts as Director of Marketing, China.
Welcome aboard Andy, we’re excited to see how you grow and lead this team!
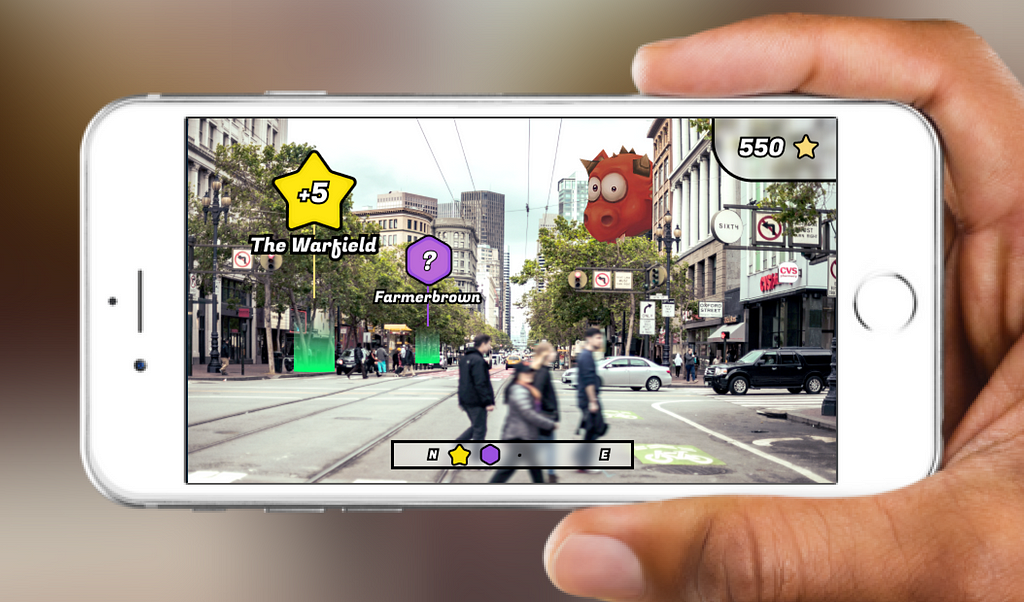
My favorite part of Mapbox is getting to see developers doing something new with maps literally every day. They are using location to create better ways to engage consumers, squeeze extra efficiency out of on-demand delivery systems, or layer geospatial information into augmented reality platforms. We’re seeing new markets emerge as we shift from maps for humans to maps built for machines in automotive and IoT applications.
As we plan the agenda for Locate, our new two-day user conference covering the most important topics in the location and mapping space, the problem isn’t finding things to talk about. It’s how to cover all of the really big questions in only two days. Here are a few of the themes we’re exploring at Locate:
Anonymized telemetry data of Plaça de les Drassanes, Barcelona, Spain colored by vehicle orientation
Maps for Machines: Maps have always been aimed at humans, but that’s changing. Maps used in autonomous driving require entirely new levels of accuracy and latency, pushing the boundaries of AI and deep learning to the edge of the networks.
Big Data Visualization: The ability to visualize massive, real-time data sets and derive valuable insights is creating new ways to manage businesses from ride-sharing to government to humanitarian relief efforts.
Custom Data on Custom Maps: No single map can do it all anymore. Apps like Snapchat, The Weather Channel, Woov, Lonely Planet and Hot Stepper are creating new ways to interact with maps, merging their data with location context, and customizing the experience to drive engagement, build new revenue models, and make their brands stand out.
Live Data: Maps used to be built on static data. Not anymore. Maps today are being rebuilt every minute based on feedback from millions of end points. This is the era of “living” maps, where your users directly influence the performance and intelligence of the map.
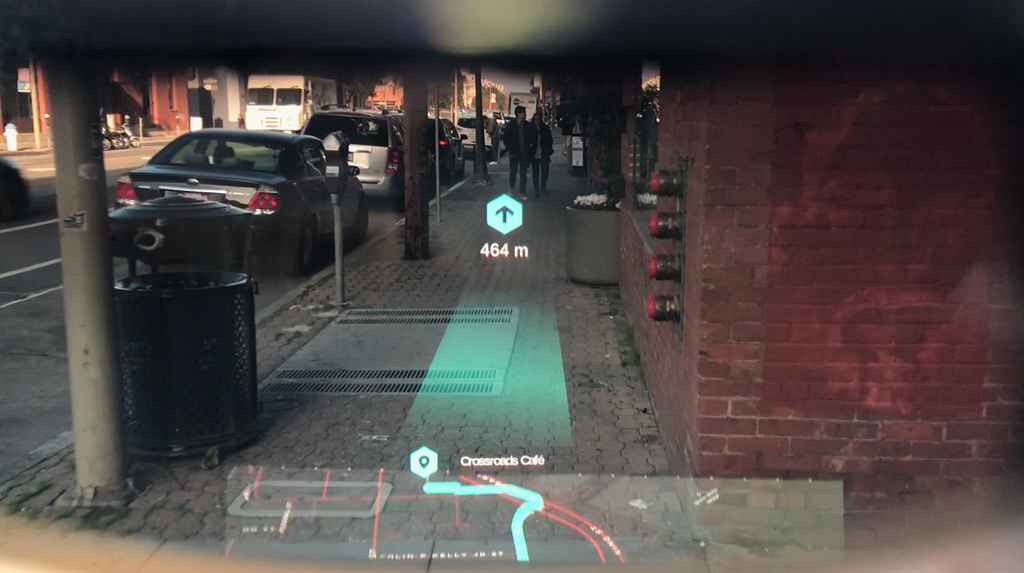
Augmented Reality: We’ve just started leveraging the 200M+ AR-enabled mobile phones to build apps that project map data into the real world. We’re adapting our thinking and our tools to inspire new user interactions with physical and virtual space.
Locate brings together the best practitioners from around the world to talk about the present and future of maps. We’re lining up some great speakers who will be hitting these key themes and looking at their implications and strategies. There will also be sessions where builders can dive into code-level discussions on advanced mapping topics.
Keep an eye out for more information leading up to Locate with interviews and posts on what to expect, and follow #explorerswanted on Twitter for updates. Locate will be theplace where the mapping world can dig into big ideas and challenges. We’ll see you at Locate.
Our focus at Locate was originally published in Points of interest on Medium, where people are continuing the conversation by highlighting and responding to this story.
Ring, recently acquired by Amazon, has come a long way from their 2013 appearance on Shark Tank pitching Doorbot, a WiFi-enabled doorbell. They’ve grown to offer all kinds of IoT security products including indoor and outdoor cameras, a Floodlight cam, outdoor WiFi enabled lighting, and a professionally monitored security system.
With their mobile apps for iOS and Android, Ring is expanding beyond the home, using maps and location data from their network of devices to make entire neighborhoods safer.
With our Maps SDKs for Mobile, they’ve created a custom interface for users to share real-time crime and safety updates with neighbors, including videos, photos, and text-based posts. Users set a “Neighborhood radius” and receive real-time alerts for that area, all contextualized on the map, allowing them see where it happened immediately.
Congrats to Ring on their recent acquisition! We’re excited to see what’s next from them with maps and IoT. Learn more about our tools for fast, custom maps on mobile or reach out to our team with any questions.
Washington DC Mayor Mariel Bowser and Police Chief Peter Newsham launched Crime Cards today. Crime Cards is an upgrade from your usual static crime map — it’s a living dashboard that allows DC residents to browse and download crime data across all eight DC wards.
Barney Krucoff,Julie Kanzler, and the team at OCTO built a backend database of hundreds of thousands of incidents on Elasticsearch, using Mapbox GL to power fast, front-end maps. The “conversational” search interface makes working with this complex data set very approachable. We love that they’re making the project open source (soon on their GitHub) — we’re excited to see other cities adopt and extend crime mapping.
Click the image to test drive Crime Cards.
I’m incredibly honored to be with Mayor Bowser, Police Chief Newsham and interim CTO Barney Krucoff to announce the launch of Crime Cards. DC Crime Cards is a collaboration between the Metropolitan Police Department and Office of the CTO, and the app has been one of the most popular data apps for the district. The Mapbox team is very proud to be powering the app and helping build a safer and stronger DC — where Mapbox was founded and where we will continue to grow our presence. - Mapbox President & COO, Roy Ng
Police Chief Peter Newsham, Mayor Mariel Bowser, Interim CTO Barney Krucoff, Roy Ng and Mikel Maron on launch day.
Urban mapping projects like Crime Cards are part of our DNA. One of the earliest maps we made was Stumble Safely: a map that helped DC residents find safe walking routes. We’ve worked with the DC government on traffic safety mapping; startups like JUMP Mobility to map bike share usage; and nonprofit organizations to document community history.
We’re proud to help our hometown be safer and stronger. Connect with us at Mapbox Cities to learn more.
With our Android Places Plugin, quickly add in-app search with only four lines of code. Your users can search addresses and place names within your app so it’s easy to find what they’re looking for without kicking out to other apps. They can plan a date, find a restaurant, or meet-up with friends, all in one interface.
In-app search on Android
As the user types, place predictions display immediately along with any previously searched destinations, and you can access metadata like websites, addresses, and contact information. Enable users to define their home, work, and favorite places, so when they search, they can access these locations without actively typing their names.
Intent intent = new PlaceAutocomplete.IntentBuilder()
The Places Plugin allows you to customize the look and feel to match your brand, and you can filter results to show places only relevant to your app. So if you’re a dating app, you might rank restaurants, coffee shops, and night-life over other business listings.
Reverse geocoding with Place Picker
In cases where the user chooses a location on the map using coordinates rather than addresses, the Places Plugin supports reverse geocoding through the Place Picker function. Just like in-app search, you can fully customize the look and feel.
Get started with our Places Plugin and add in-app search to your app with four lines of code. Have questions? Reach out to our sales team.
In-app search for Android was originally published in Points of interest on Medium, where people are continuing the conversation by highlighting and responding to this story.
Whether you’re new to our stack, preparing to move from Mapbox.js -> Mapbox GL JS, or curious how common map concepts are implemented across platforms, explore our new Interactive tools. These “Playgrounds” are designed for hands-on learning. Choose your use case and customize the output, then generate platform-specific code so you can publish your map ideas faster. 🚀
Markers are custom images you can use to annotate a map and designate points-of-interest. In the Marker playground, you’re able to choose your platform — web, Android, iOS, React Native — add a marker image and generate starter code to drop right into your application.
You’ll have a working prototype in less than two minutes. Just testing? No worries, we also link to JSBin.
Static API Playground
Sometimes you need to generate a static map to use as a thumbnail or embedded element that displays useful information but doesn’t need to be interactive. Jump into the Static API playground, and we’ll walk you through building a request to the Mapbox Static API.
We featured this playground with step-by-step instructions for creating custom wallpaper for your phone from your favorite maps or satellite images. There are a bunch of ways you can extend the functionality from there, like adding custom overlays for ride receipts or including maps in push notifications.
Tell us how about the projects you’re building and how you’re using the new playgrounds. Tweet @Mapbox using #BuiltWithMapbox or reach out to our Support team to submit feedback.
We’re building the tools to power location context in world-scale AR and to bridge games and apps with the real-world environment. Given that many developers are new to the location-based experience and AR fields, our goal is to make the process of development in the space intuitive without sacrificing on the full power and flexibility of our tools. That includes the tools and data to successfully go from tabletop AR to world-scale AR.
Developers will realize the full potential of AR at world scale, and we want to give them the data necessary to power the location context to achieve it. Here’s a look at what’s to come with the Maps SDK for Unity:
Coming soon
Make a map in a minute or less. Plug-and-play templates for major use cases like:
Location-based games
City simulation and modeling
Location-based AR
Out-of-the-box styling templates that look beautiful:
Choose from new Mapbox styles or use them as starting points to create your own custom styles for map features like buildings.
Fix split buildings at tile edges.
More intuitive functionality, less time learning about the SDK and GIS:
Surface common functionality into the user interface to speed up the development process.
Make it easier to use POIs for triggering events.
Make it easier to import custom POIs.
Continue to improve documentation and tutorials, including video-based tutorials.
Make it easier to create good world-scale AR experiences:
Improve AR localization as a major step toward a better developer experience for world scale AR.
A preview of default styling and customization
On the horizon
Expand on core features:
New layers of data designed for location-based gaming and AR.
Make it easier to generate procedural and manual mesh & texture styling.
Our team’s vision is to enable developers to use our Maps SDK for Unity to create immersive, location-based experiences in 3D and world-scale AR. We’re making our priorities transparent and accessible to the community, and we’d love your input on GitHub.
Caribe Wave 2018 is a yearly international exercise, organized by UNESCO, to increase tsunami preparedness in the Caribbean Sea…and it’s happening today. As we’ve seen over the last few decades, earthquakes and their subsequent tsunamis pose a huge risk to populated areas and it pays to be prepared. For this year’s exercise, we’ve updated our satellite imagery of some Caribbean islands to help stakeholders create better risk assessments, plan evacuation routes, and more.
In one of the three scenarios for the Caribe Wave 2018 exercise, a magnitude 8.6 earthquake will occur at 14:00UTC near Barbados island. One hour after, a >3 m wave will hit the southeast coast of Marie-Galante near the quiet village of Capesterre. (source)
About 45 million people live on islands in the Caribbean Sea, with many more along its Central and South American coastlines. Geologically, the region centers on a small tectonic plate that’s active on every side. There are frequent small earthquakes and occasional large ones, like the magnitude 7.0 near Port-au-Prince, Haiti, in 2010 — the volunteer response to that earthquake led to the formalization of the Humanitarian OpenStreetMap Team.
Recent location data is critical for disaster preparedness and response. With up-to-date imagery and elevation data, coastal communities can monitor infrastructure, map efficient escape routes, designate staging areas, and flag new at-risk developments. Proactive efforts like these help create geo-infrastructure that could save lives during a crisis.
The data we’ve added today is beautiful open aerial imagery from IGN, the French National Geographic Institute, under their Licence Ouverte. (Guadeloupe and Martinique are départments of France, which incidentally makes them the largest outposts of the European Union in the Americas!)
Left: Grande-Anse beach, Basse-Terre, Guadeloupe. Right: La Grande Soufrière volcano, Basse-Terre, Guadeloupe. With a summit reaching 1,467 m, La Soufrière is the highest volcano of the Lesser Antilles chain. Its last major event happened around 1580. Click images to enlarge.Left: Fort Napoléon, Iles des Saintes (“Islands of the Saints”), Guadeloupe. First named Fort Louis, it’s now a museum and rumored to be haunted the spirit of a young girl. Right: Les Trois-Îlets, Martinique Island. Click images to enlarge.
The data is now in mapbox.satellite, available for tracing in OpenStreetMap, and ready for everyday basemap use. Check out our guides to learn more about using imagery to add data to OpenStreetMap to contribute to disaster preparedness projects like Caribe Wave.
Zack Mertz is the VP of Design and Production at Concept3D. Concept3D is a software platform that combines mapping, 3D/virtual reality and data for internal and external enterprise use. Using Mapbox GL Concept3D creates complete 360° 3D rendered maps. Concept3D used the recent launch of the Falcon Heavy rocket to explore the capabilities of Mapbox GL further.
Creating true 3D in digital is becoming possible with advances in VR/AR, and with improved technologies that enable 2D devices like computers and mobile devices, we’re able to push 3D rendering and maps to the next level.
To prototype these capabilities, Concept3D used Mapbox and several other applications to recreate the launch site of SpaceX’s Falcon Heavy — the most powerful operational rocket in the world. Take a look at it live and launch the rocket for yourself.
We started building this core model in SketchUp, but found that if we rendered the model using WebGL at that level of detail — with a massive number of polygons — the load time was minutes vs. seconds. So to allow for a more acceptable load time — as well as to add texture — we modified the 3D model in Photoshop and Blender. We were inspired by threebox, a library built by the Mapbox’s Peter Liu that uses Mapbox GL JS to render a Three.js scene. So, we used Three.js and Mapbox GL JS to generate, add, and manipulate the models dynamically. Finally, we used geospatial anchors to lock the objects into space on the Mapbox map.
3D renderings are typically only accessible via one view (such as top-down). By using Mapbox with Three.js, we gave the user the ability to spin, move through, around, and above the scene while maintaining the same level of detail and quality.
Concept3D is using Mapbox to offer an enterprise platform that gives clients the ability to bring their physical spaces and assets into the digital world. To incorporate Mapbox into your project, sign up now or reach out to our solutions team for more information.
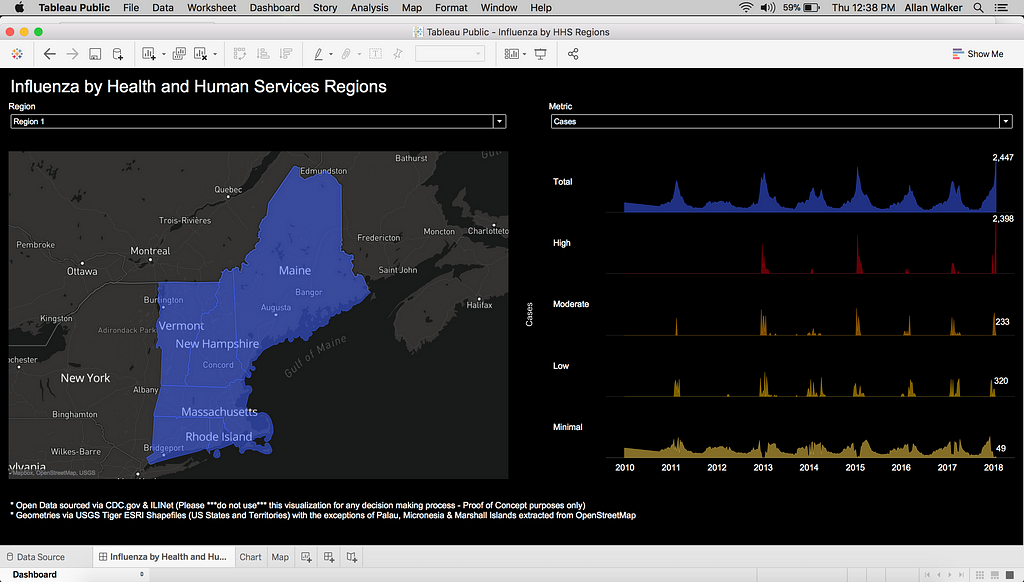
This is Part II in a series of projects for understanding and analyzing healthcare provider data. Check out Part I — Part II will walk you through further customizing your map and data, this time to assess illness incidents and reporting.
Healthcare organizations are usually split up into regions to help distribute efforts in recording incidents and reporting. For this project, I imagined that a regional manager or director would want to explore reports about each region using a map as the interface. Healthcare analysts can use our Business Intelligence tools in their own workflows to incorporate custom, interactive maps into dashboards. This makes it easier to derive insights by location and explore large datasets.
I’ll walk through creating a basemap in QGIS that displays labels for each region (including all islands and territories), customizing the style and presentation of the map with Mapbox Studio for use in a web dashboard, and then connecting the map to the data in Tableau. We’ll combine three distinct datasets, all without any code. This project is made entirely with open data — anyone with a Mapbox account and Tableau Public can make this visualization.
Something is missing
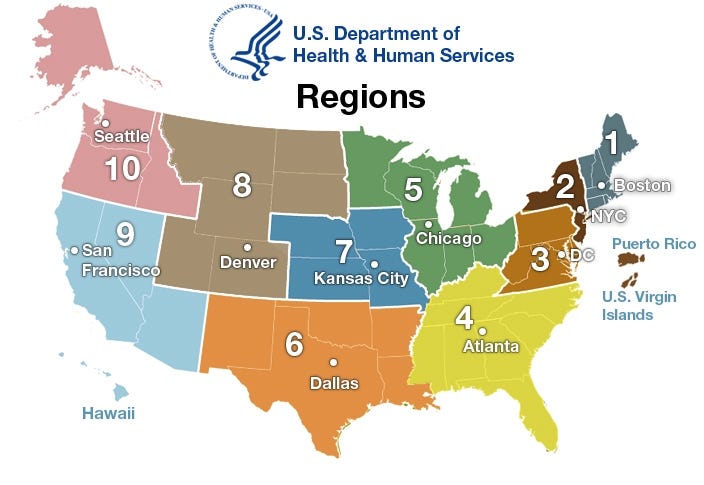
The United States Department of Health and Human Services organizes its Regions like this:
Map of US Department of Health & Human Services Regions created by Office of Intergovernmental and External Affairs (IEA)
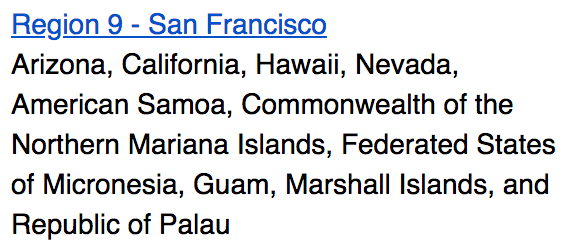
However, reading through the text, something popped out to me about Region 9 — San Francisco.
I can see Arizona, California, Nevada, and Hawaii on the map, but I can’t see the other islands. So if we want to view an interactive report by region, we’ll need to add these islands to the map and group them with the Regions they belong in.
Building the custom Regions map
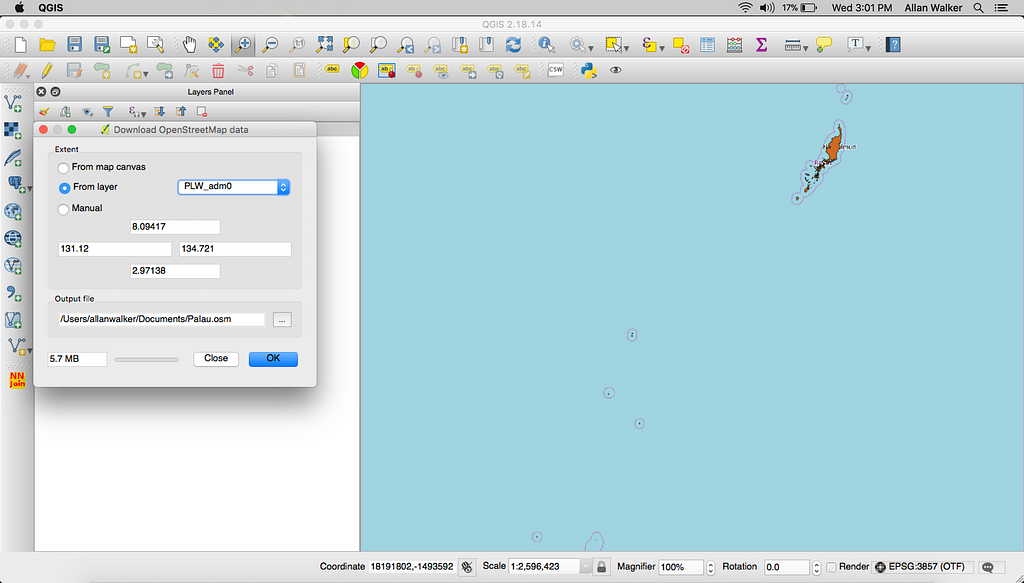
First, we’ll obtain the shape files for all of the Regions: download USGS TIGER/Line® ESRI Shapefile “States”, and then export the polygons of the islands— Micronesia, Marshall Islands, and Palau — from OpenStreetMap, using the template shapefiles from GADM.org.
Downloading OpenStreetMap data in QGIS using GADM.org layers, Palau depicted
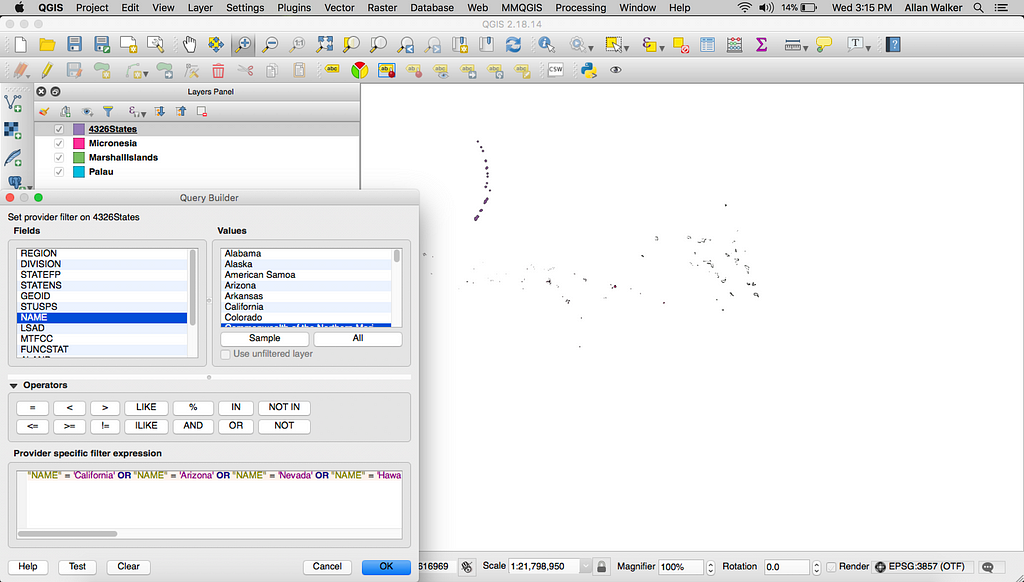
Filter down the USGS TIGER/Line® ESRI Shapefile “States” file for the States and Territories in Region 9.
Filtering States on Name
Let’s then save the States file with a projection of WGS 84 EPSG:4326 with just the NAME attribute. Do the same for Micronesia, Marshall Islands, and Palau.
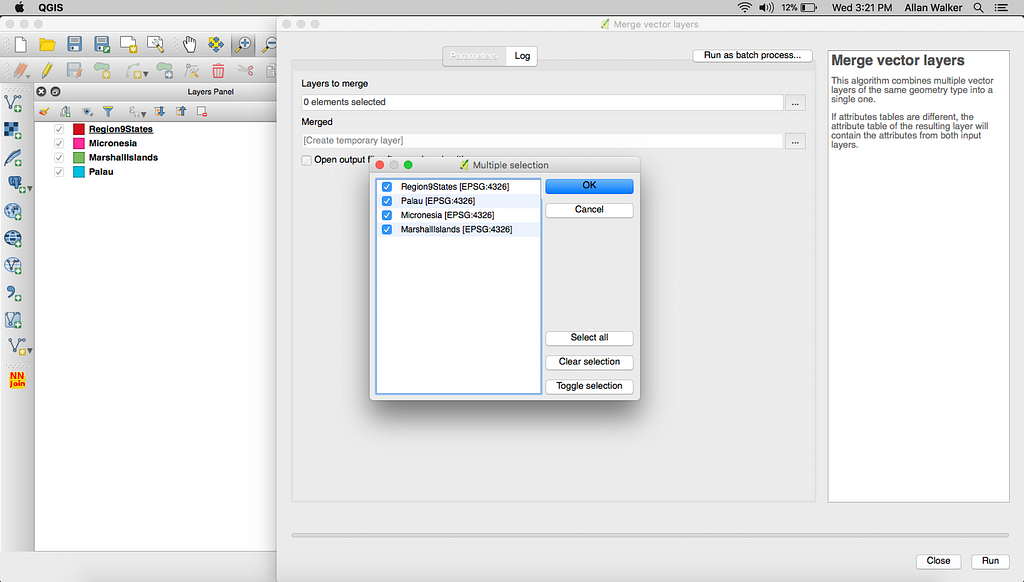
next, we’ll merge these files together (Menu → Vector → Data Management Tools → Merge Vector Layers).
Merging Layers
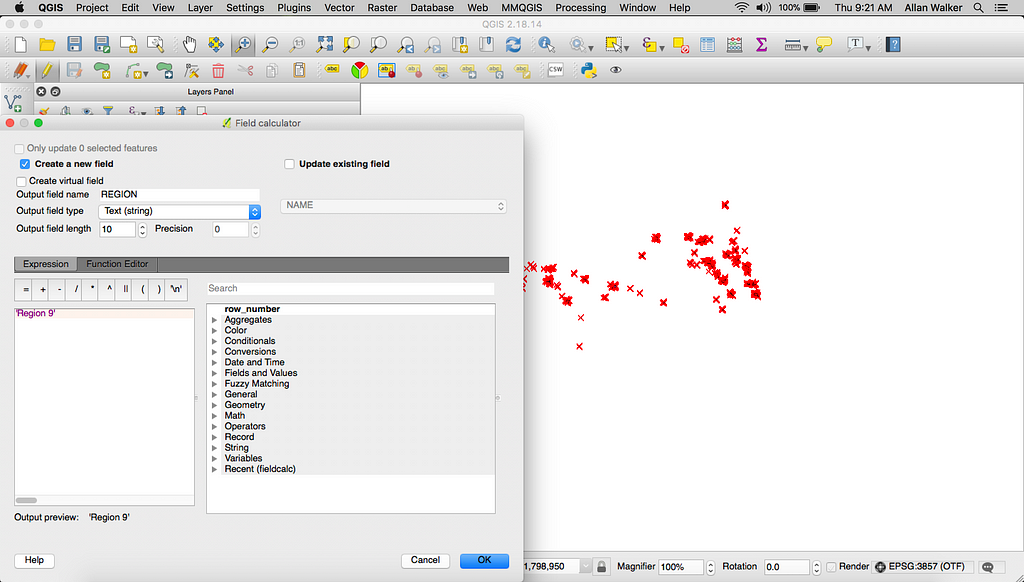
We also need to merge a column called REGION to the merged file using the Field Calculator (Menu → Layer → Properties → Toggle Edit Button (Pencil Icon) → Field Calculator (Abacus Icon).
Adding a REGION field with the QGIS Field Calculator, Edit Mode has been turned on.
Let’s do the same for the nine other Regions, filtering down the States shapefile, adding a REGION field, and saving each one back with a CRS of WGS 84 EPSG:4326. We’ll then merge the ten shapefiles together into one shapefile called HHSRegions.shp.
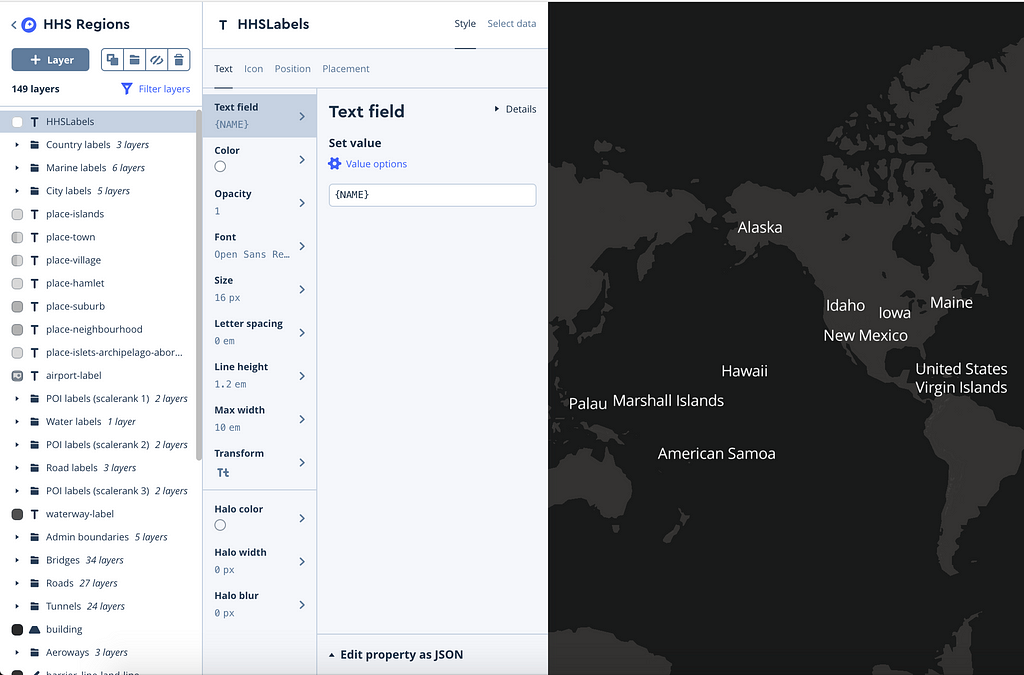
As a final step, we need the centers (Menu → Vector → Geometry Tools → Centroids) of the HHSRegions for labels as the background map in Mapbox for Tableau.
We can now save this file as HHSLabels.geojson and upload to Studio as a tileset, adding it to the “Dark” map style.
Mapbox Studio Style HHS Regions with HHS Labels tileset added to the “Dark” basemap
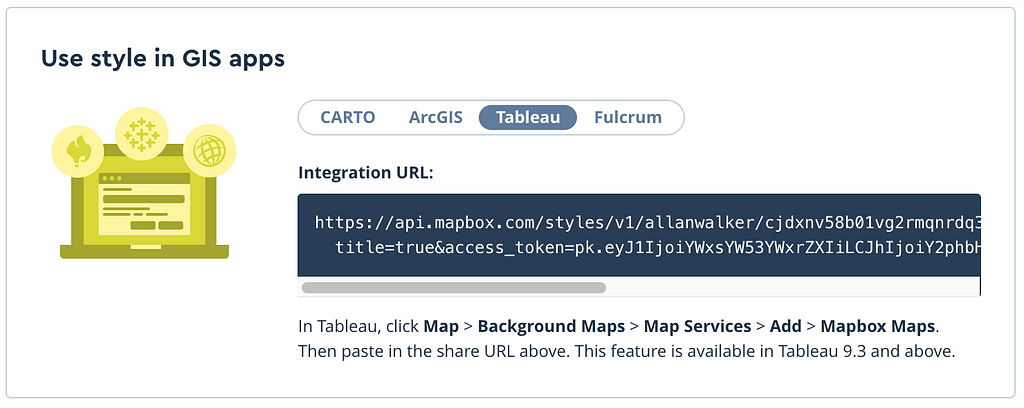
After it’s uploaded, click the Share, develop & use button next to the list of styles:
We want to select Tableau from the list, and copy/paste the Mapbox Integration URL into a notepad so we can use it later to pull the map into Tableau.
Getting the map ready for Tableau
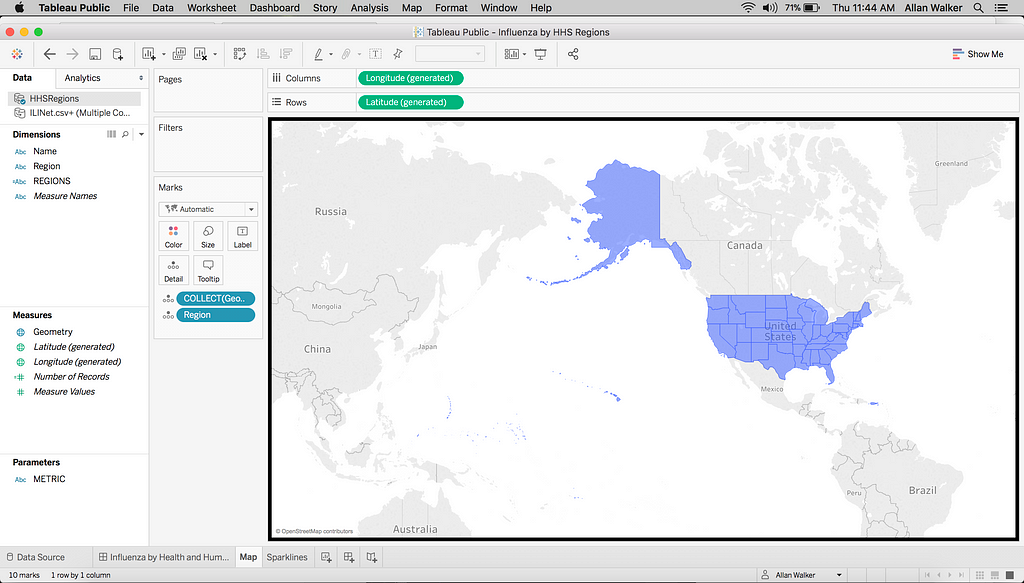
After importing the ESRI Shapefile into Tableau (Connect → Spatial File → Navigate to HHSRegions.shp), create a worksheet called Map and set it up with Longitude on Rows, Latitude on Columns, and Geometry on the detail mark shelf. Let’s set the color to blue and change the transparency but keep the same color for the outline.
Tableau worksheet with imported ESRI Shapefile HHSRegions
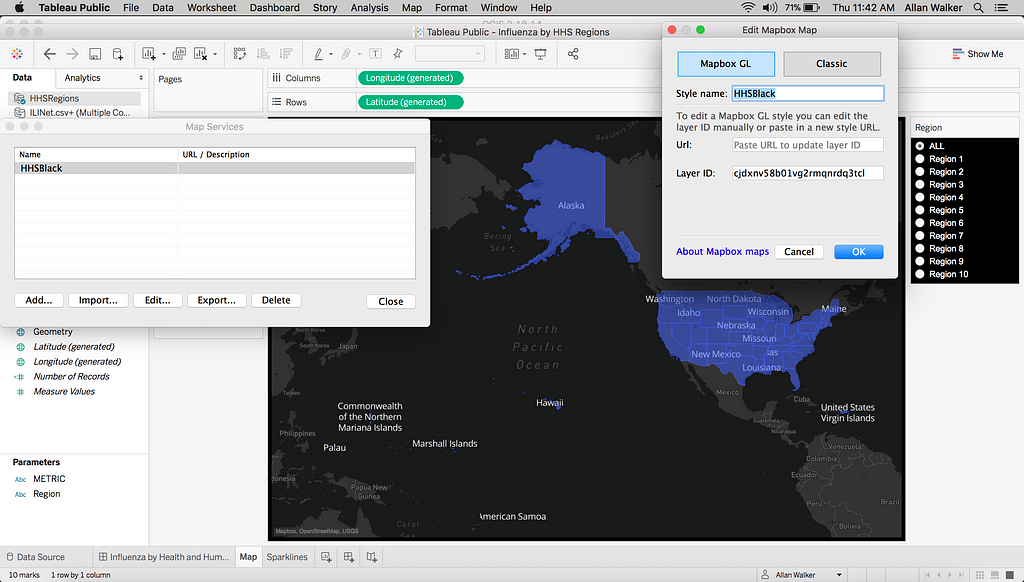
Next, we’ll paste the Mapbox Integration URL we saved in Notepad (Menu → Map → Background Maps → Map Services → Add → Mapbox Maps).
Tableau worksheet with custom Mapbox Studio style integration
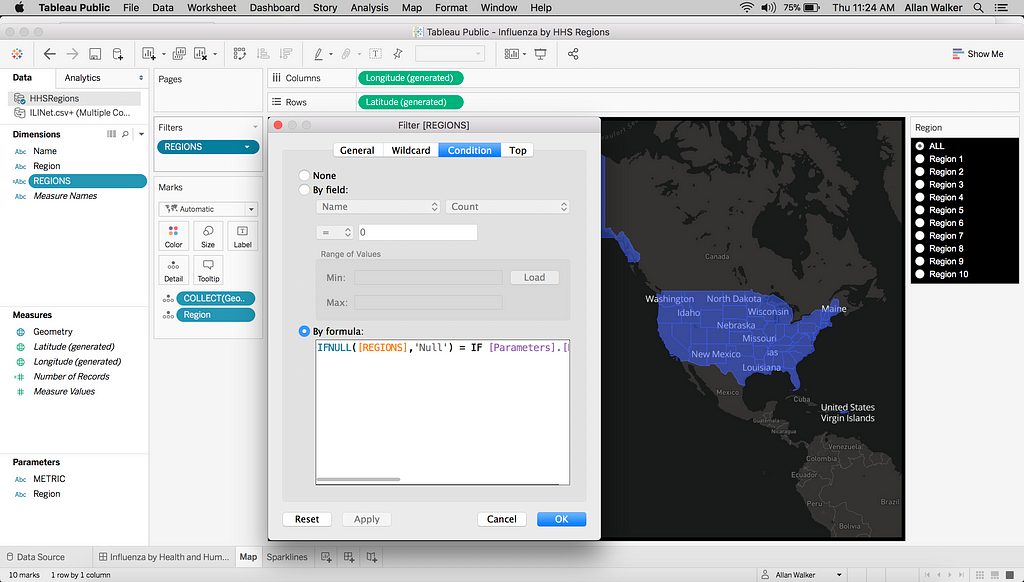
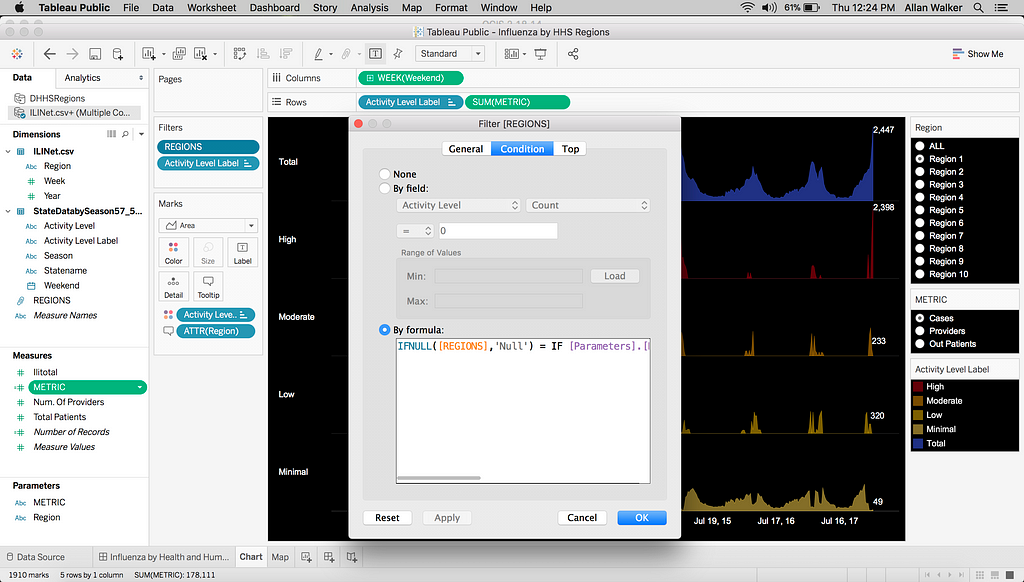
After adding the map, we need to generate a parameter called REGION, adding the Region Names and another value, ALL. We can conditionally filter the Regions with this calculation (credit Ben Sullins):
IFNULL([REGIONS],'Null') = IF [Parameters].[Region] != 'ALL' THEN [Parameters].[Region] ELSE IFNULL([REGIONS], 'Null') END
Now, when you choose “ALL” in the parameter, all of the Regions will show.
Tableau worksheet with a conditional filter using parameter values
Getting the data ready for Tableau
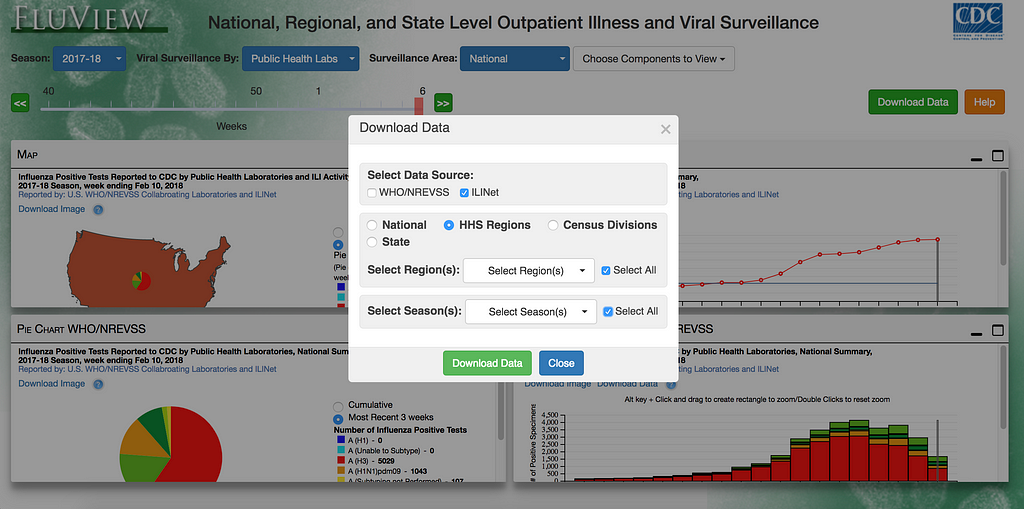
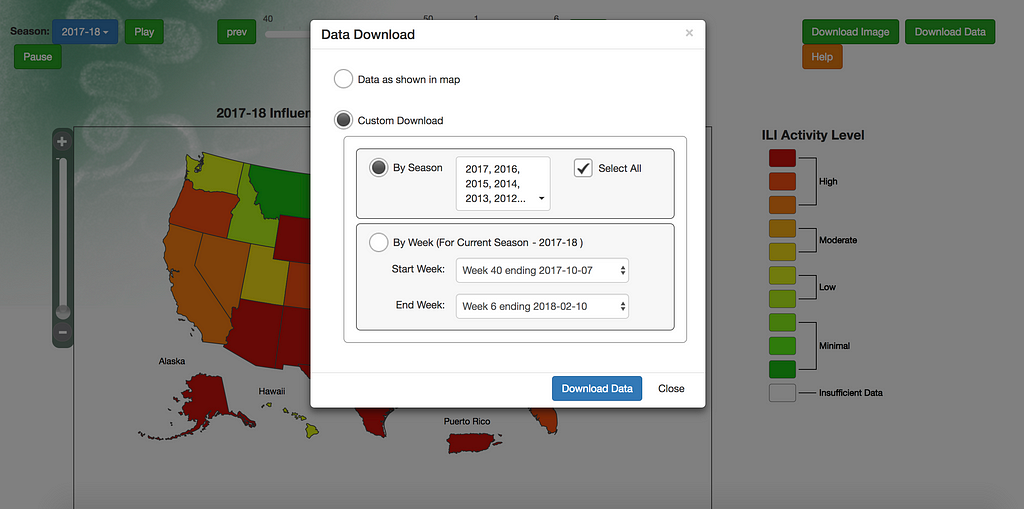
For this project, we’ll use Influenza data from CDC GIS Fluview and select ILINet and HHS Regions to generate a CSV file.
We need to join the data on Year and Week, grouping States to Regions (Connect → Text File → Navigate to ILINet 2.csv & Connect → Text File → StateDatabySeason). We can then create a new worksheet called Chart. Let’s use the same conditional filter as the map worksheet.
Tableau worksheet re-using the REGIONS conditional filter, the same as the map.
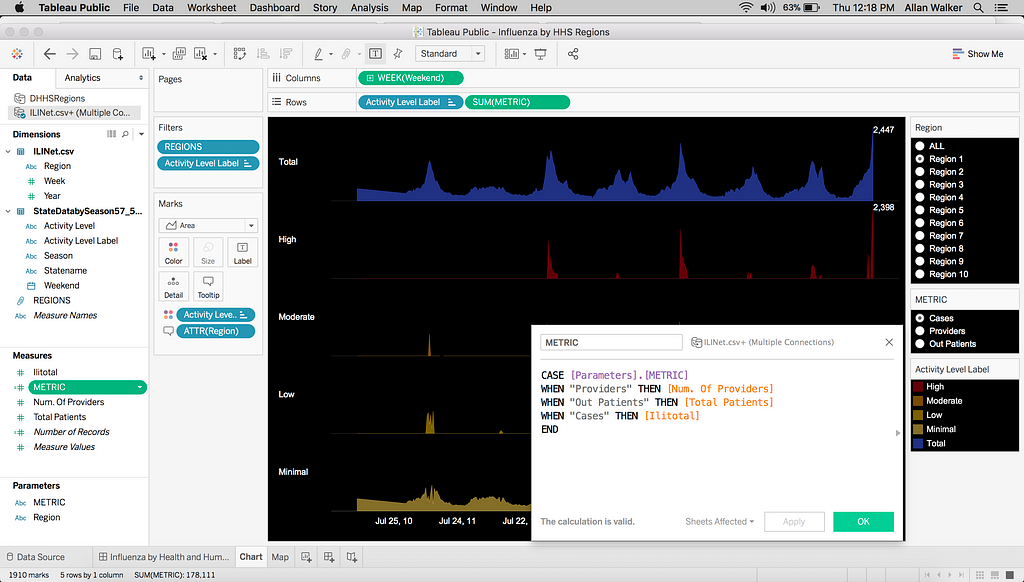
We’ll also create a metric swapper parameter and a case statement calculated field.
Tableau worksheet with Case Statement Calculated Field to swap metric
Building the dashboard
We need to first add the worksheets and the parameters (Menu → Analysis → Parameters), including a Title as well as a caveat recognizing the data sources. Let’s then publish to Tableau Public (Menu → File → Save to Tableau Public).
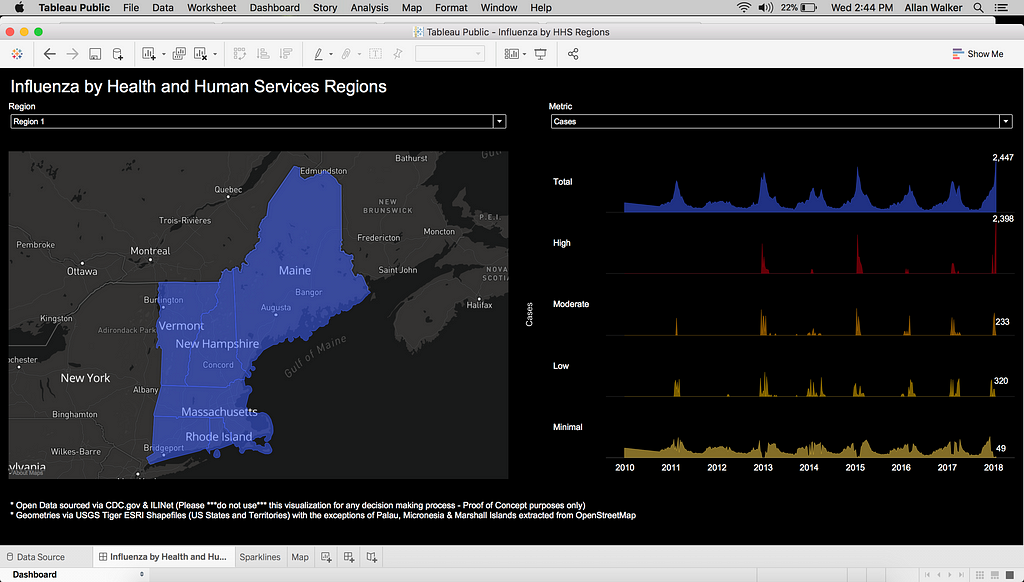
Click through to see the Dashboard on Tableau Public
Healthcare analysts using this tool, or one like it, can select their Region and choose the metrics they want to explore. A person at the Director level could view data for all Regions they oversee.
Our business intelligence tools make it easier for health organizations to track resources, staffing, and other efforts to minimize per-patient costs at every administrative level, from individual facilities to national and regional boundaries.
Day 1 Donkeycar racing team signups are open. Each team should be made up of no more than 5 people, but honestly we have no way of enforcing this.
Micro self-driving cars rules:
No tele-operators.
No V2V lasers to intentionally interfere with other cars.
Mapping software used to mine bitcoin needs to be disclosed to the SEC.
We‘ll launch the Donkeycar Maps SDK on April 2nd, giving each team 6 weeks to add HD Vector Maps, encoded with the track geometry and libraries, to decode the coordinates for the race trace. Some participants do all analysis on-device, others will transmit the data from their on-board sensors (cameras, sonar, LIDAR, radar, GPS or whatever else you have) via WiFi to a laptop that runs pro-grade AI and robotics software, including TensorFlow, ROS or the Udacity Self-Driving Car Nanodegree toolchain. Both approaches are allowed.
Judging is based on four best-of-class categories:
Neural networks FPS rate on front facing cameras
Localization using high percision GPS
LIDAR implementation under $100k
Last car standing
We will also give awards to anyone who open sources their training model or code as part of their entry.
Is the world changing at a rate that’s outpacing our ability to capture that change? -Young Hahn, Mapbox CTO
Maps used to be built on static data. Not anymore. Maps today are rebuilt every minute based on feedback from millions of anonymous sensors. This is the era of “living maps”, where your users directly influence the performance and intelligence of the map.
Static data models begin to break down when applied to large-scale logistics and automated services, where old data means a bad user experience. A ridesharing company needs to adjust operations in real time as traffic patterns and road infrastructure change. On-demand delivery services need to time pick-ups and drop-offs accurate to the minute. And a live-updating map is critical for autonomous driving, where there is no longer a human buffer between the map and changing conditions on the ground.
At Locate, our two-day user conference May 30–31st, we’re looking at the tooling and challenges of creating living maps.
Click to save your spot
We’ll talk about how we’re scaling a global network of embedded sensors. Last year, we collected 2.8 trillion location updates, and today we’re collecting over 225 million miles of anonymized telemetry data per day. All of this data feeds back into our maps and navigation, making the applications that rely on them better.
Translating GPS probes to traces, colored to show speed
You’ll hear from engineers like Morgan Herlocker, whose team is measuring the accuracy of real-time location data and deriving useable information like traffic, speed profiles, and turn restrictions.
If you think of a single directions request as a stock trade, then on-demand logistics is like high-frequency trading, where you’re taking millions and millions of potential navigation requests and matching them all to come up with the most efficient solution. -Morgan Herlocker, Mapbox Telemetry Lead
Industry leaders like Manik Gupta, VP of Product, Maps & Marketplace at Uber, and Di-Ann Eisnor, Director of Growth at Waze will discuss how live data is changing operations and navigation in the mobility space. Stay tuned as we hear from these speakers and more in the weeks to come.
We’re building the tools now that will capture the change in the world we can’t predict tomorrow. See you at Locate.
The Living Map @ Locate was originally published in Points of interest on Medium, where people are continuing the conversation by highlighting and responding to this story.
Mapbox AR is the first comprehensive toolkit combining AR rendering software with global location data that’s ready for today’s production applications and tomorrow’s dream concepts — built on our living location platform used by over 1 million registered developers.
AR is going to change nearly every aspect of our lives. We want to provide powerful but easy-to-use tools for connecting AR applications to the world around us. As the first platform to provide global reality-grade data, we can’t wait to see what you’re going to build.
Our AR location platform includes the following features to build your next AR game or experience:
Live location data: Popularity of locations determined by anonymized place visit data aggregated from over 300 million users a month allows for gameplay to adjust based on when and where people are present.
3D digital elevation model: A global mesh including real terrain height. This elevation data is tiled into small pieces to make it distributable at scale with low latency around the globe; updates are dynamic.
Multi-user, multiplayer support: Using the distance, angle, and position of the selected plane allows users interact and collaborate in real time, knowing the position of other devices by building up a 3D model of the device’s relative position and share this data between devices — the first multi-user AR experience built using the Maps SDK for Unity.
Points of interest: A geotaggers’ world atlas of locations and categories of the most interesting places and the routes that people follow between them in every country around the world, letting app developers interact with millions of real-world businesses and landmarks.
Satellite imagery compression for low bandwidth environments: Gauge bandwidth by testing the download speed and adjust compression automatically.
Rooftop UV mapping: UV map procedurally generated polygons for 3D texture modeling process for projecting a 2D image to a 3D surface.
High-resolution land cover and land use data classification: From NASA satellite imagery to identifying unique land cover classes ranging from parks to beaches to bodies of water to industrial areas, this is data that powers gameplay logic.
32-bit vertex mesh support: Load entire cities, rendering tens of thousands of buildings into a single game object.
Mapbox AR was originally published in Points of interest on Medium, where people are continuing the conversation by highlighting and responding to this story.
Morgane Santos is an engineer on the Unity team at Mapbox. She designs and builds location-based AR (augmented reality) demos. She’s been at Mapbox for 3 months; before that, she worked as a designer and web developer for several years.
6:30 am
Wake up. I love getting up early and consider myself very much a morning person. I make some tea, hang out with my cat Ripper (aka, Lil Rip), read my 3D math book, and make a warm quinoa breakfast bowl for breakfast. I like to have a lot of time for myself in the morning, and it’s a while before I check email or Slack.
If my team has an 8:30 am meeting (shoutout to international teams!), I usually take that call from home. Otherwise, I’m out the door between 8:30–9:00 am.
9:30 am
I’ll take BART to work, which only takes 20 minutes door-to-door. When I get to the office I’ll make some more tea, check Slack, check email, check GitHub. I keep a todo list in Dropbox Paper which I update every day, based on everything I just checked. This is helpful since I might have ~4 projects I’m juggling at any given moment (creating a demo, interviewing users, designing art for a blog post)… which means there’s not really a “typical day” for me!
10:00 am
Sometimes I have a lot of meetings. Sometimes I run a few user tests to get feedback on changes we’re making to our SDK. Sometimes I spend my morning drawing vectors in whatever notebook I have lying around (usually a Moleskine), trying to solve a 3D math problem (aka, the reason I have that book). Sometimes I’m refactoring and dealing with bugs; sometimes I’m coding new features for an AR demo.
NOON
I don’t miss lunch under any circumstance. I love food and eating. I might have lunch with coworkers or friends in the neighborhood — we usually get some Chipotle and, if it’s sunny, eat at Yerba Buena Park. I might eat lunch alone while reading a book. Lately I’ve been reading a lot about Greek and Roman history. I highly recommend SPQR if that interests you!
1:00 pm
Much like my mornings, my afternoons are by no means typical. I usually meet at least once a day with members of my team or our product manager to talk about the status of various projects and do some design thinking of possible new features. Our team is unique in that a lot of our work is experimental: we’re trying to push the boundaries of AR and see what’s possible with it. Mapbox gives us a lot of freedom to try new things, which is truly amazing.
Lately a few of us have been working on a demo for GDC (Game Developers Conference), where I was able to control the design and all my “far out” ideas were supported. People here are willing to take risks, which makes the work even more exciting.
I’m also an organizer for Mapbox’s gender minority ERG (employee resource group), and afternoons are when we host office hours. Office hours give everyone at Mapbox a chance to learn more about gender minority issues or talk about what’s moving at the company to make it more inclusive.
Last but not least, I’m an active members of #sf-cookiers, a channel for SF folks who want to take a walk in the afternoon to go get cookies 🍪.
5:30 pm
This is usually when I leave work. I might go to the gym, or just head home on Muni light rail — it’s more scenic than BART and the longer commute home gives me more time to read (I read a lot), listen to music, or stare into space a little bit.
6:00 pm-bedtime
I’ll usually put on a record and make dinner as soon as I get home. I’ve been listening to Mndsgn’s Body Wash a lot lately; very funky, mellow album, and part of our small (but growing!) vinyl collection. Most nights before going to bed, I’ll watch “King of the Hill” with my boyfriend, which is a truly great way to end the day.
Interested in joining Morgane at work? Take a look at our career pages for chances to meet her (or maybe one day Lil Rip) + check out #sf-cookies.
TL;DR: I built a small Robocar that can use either Computer Vision or Machine Learning to drive autonomously. It uses Android, off-the-shelf hardware components, and the code is available on GitHub. Come and join us for racing @Locate May 30–31; Donkeycar racing team signups just opened.
Earlier this year Android launched Android Things, a flavor of Android that runs on Raspberry Pi and similar IoT devices; so I did the reasonable thing to do — I built an autonomous RC car from scratch.
The hardware: building your Robocar
For the hardware, I just bought all off-the-shelf components. I had a feeling that there would be a few crashes before my neural networks were fully tuned, so I wanted to be able to replace broken pieces easily. The shopping list is short (a little over $100):
A Raspberry Pi (about $35).
A motor controller (about $22) — turns out that you can’t connect motors directly to a Raspberry Pi (early lesson)
A portable charger to power the Pi and the motors (about $30).
And, finally, a frame. This Junior Runt Rover is a good starting point ($28) but you could recycle an existing frame from another toy.
The car can be controlled using a companion app (also built with Android) that uses a local server to communicate with the car. However, I decided to use a retro Nintendo controller (this adds an extra $35 to your budget). Putting it all together is documented; a couple of things to note:
Soldering time: I haven’t been able to find a Raspberry Pi-compatible motor controller that comes pre-soldered. You’ll need to dust off your soldering station or find a friend with one. It isn’t difficult, but it requires some practice considering the small size of the pins.
There’s life beyond the Raspberry Pi: Android Things is an abstraction layer over IoT devices and while Raspberry Pi is the most popular one for hobbyists, other boards will work out of the box without having to change a single line of your code. My favorite so far is the NXP Pico. The advantage of this board is that it comes with fast onboard storage (so you don’t need to buy an additional SDCard), and it contains a SoM (System-on-Module). This is the kind of module that real production devices would use if you wanted to productize your hardware project.
Software for your autonomous Robocar
This is where things got a little bit out of control. Udacity has a self-driving car “nanodegree” that teaches you how autonomous cars work. They cover things like Computer Vision and Deep Learning for recognizing lanes and pedestrians, all from a very practical angle where you get to code on simulators (they use Unity).
One of the first things you learn during the class is that there are two different approaches that autonomous cars use to recognize objects (often together): Computer Vision and Machine Learning. Regardless of the approach, you’re gonna require a camera capable of taking pictures of what’s in front of the car. That’s the easy part. Nowadays, you can get an 8 megapixels camera for about $30 that connects directly to a Raspberry Pi and the other boards we mentioned before.
Computer Vision for Robocars
The CV approach basically consists of applying image filters and transformations to pictures taken from the car and extracting information about lanes (the camera needs to be positioned fairly high to have a good angle). To make this analysis performant and have the car respond in “real time” to the information captured by the camera, I used an approach similar to the one we use with our Maps SDK: do the heavy lifting on C++ (with OpenCV) and expose the methods needed on the Java side so that Android can make decisions on whether to turn or continue going straight.
Once this was done, one possible pipeline goes like this. Let’s start with this image, part of the project test suite:
Transform the image so that it looks like the photo was taken from above (if you’re familiar with OpenCV, this is the combination of applying getPerspectiveTransform followed by warpPerspective). This removes any distracting objects surrounding the picture and lets you focus on the lanes:
2. Do some color thresholding to separate the lanes from everything else in the picture. Depending on the color of your lanes (bright yellow tape in my case) it’s useful to change the color space from BGR (OpenCV’s default) to HSV (Hue, Saturation, Value). This color space fits better with the way human vision perceives colors and makes filtering a specific color easier using hue and saturation ranges:
robocar_threshold_color
3. Finally, we need to compute a histogram to find the most likely location for the lane (represented by the vertical line below):
Putting it all together, you can instruct the car to center on the lane before advancing:
Next is adding Lidar support 😃 . If you’re curious to see how this looks with pictures from a real car, check out this video. It’s one of the exercises you have to make during the Udacity training.
Machine Learning for Robocars
Another way to tackle this problem is using Machine Learning (aka Deep Learning Convolutional Neural Networks) to teach the car how to drive autonomously. You use real-world data to train a model to classify traffic signs or to make the car make driving decisions using behavioral cloning. You need to take thousands of pictures, and for each picture, you need to encode information that you want the car to learn (e.g. the speed of each wheel).
The problem is that designing a Convolutional Neural Network from scratch isn’t trivial and goes beyond what I wanted to accomplish with this project. So what I did instead was to take advantage of NVIDIA’s public research in the field (see this paper) and implement one of their network architectures. This one in particular consists of 9 layers, including a normalization layer, 5 convolutional layers, and 3 fully connected layers:
With tools like Keras, this is something that can be implemented in just a few lines of code.
Note that this is all implemented in Python instead of Java for two reasons: On one hand, Python is probably the de-facto language for ML these days. It has great libraries and documentation, and it seems to be the language of choice for frameworks like TensorFlow. On the other hand, training a model is something that you wouldn’t want to do on a Raspberry PI anyway, it’s slow and taxing on such modest hardware. Instead, you’d want to use a powerful laptop or a server in the cloud.
The Robocar Racing Community
The best part is being a part of a group of enthusiasts building their own small, autonomous cars (“robocars”). This is a meetup that Chris Anderson started in Oakland, CA that quickly expanded to other locations. You might know him from his time at Wired magazine or for starting DIY Drones. He likes to say that his passion is to put “the letters DIY in front of a big established industry and see what happens.”
I am involved with the DC chapter, and in less than a year we’ve organized a dozen events, and we now have more than 200 people registered. This chart below, comparing CV vs ML, comes from a recent Robocar meetup. As you can see, both are doing pretty well, and while CV obtained better results faster, looks like the ML approach is quickly catching up:
Enter your racing team @ Locate
If you’re interested in learning more about autonomous cars, or their smaller siblings the Robocars, join us at Locate.
If you’re familiar with Java/Android, follow the instructions on how to build your own Android Robocar. If you prefer Python, the Donkey Car project is the best place to start. Its code and build are more advanced (it comes with 3D models that you could print), but definitely worth the investment.
Check out the next DIY Robocar meetup in SF, in DC, and other locations. Even better, start your own if one isn’t available in your area.
Codoon is one of the top social fitness apps in China with over 100M users around the world. As running, hiking, and other outdoor activities are growing in popularity in China, more users are relying on smartphone apps to track activities and connect with peers.
You can now track your exercise routes and progress in 3D AR with the latest version of the Codoon app, providing a more interactive experience and a new way to share content with friends.
The Codoon app is built with our Maps SDK for Mobile, allowing users to discover nearby routes and track stats for each route, all contextualized on a custom map. The latest iOS update adds a new AR playback feature so users can visualize their activities in 3D. This feature is built with our Maps SDK for Unity, which provides developers the tools to create location-based 3D and AR experiences.
Codoon users can visualize their routes in 3D AR for all types of terrain, from flat land to coastlines to mountains.
Recently, Sean Gillies talked about how Rasterio is built for cloud-hosted files. The python library can also be easily packaged for cloud services like AWS Lambda. The Mapbox Satellite team loves Lambda functions. While they can be powerful (e.g. landsat-tiler), they can also be frustrating when creating the package itself. I’ll share some tips and tricks for making complex Lambda functions:
AWS Lambda Limits
250 Mb size (100Mb zip)
3008 Mo (was 1536Mo until Dec 2017)
5-minute runtime
Good to know
Lambda runs on CentOS 7.0 Amazon Linux AMI (Docker images)
A python Lambda package is equivalent to the content of your site-packages directory
.zip packages are uncompressed in /var/task at runtime
If you don’t need complex python modules (e.g. C extension modules), creating a Lambda package is a straightforward process.
pip install my-module -t ./my-package
cd ./my-package && zip -r9q my-package.zip *
zip -r9q my-package.zip my_handler.py
But when you need Numpy, SciPy, Rasterio, or Tensorflow, it can get challenging. In the past, you had to create the package on AWS EC2, using Amazon AMI Centos Linux image. This changed when AWS released their Linux image on DockerHub, meaning that you can now do everything locally in seconds.
Dockerfile
# Dockerfile example
FROM amazonlinux:latest
RUN yum install -y gcc gcc-c++ freetype-devel yum-utils findutils openssl-devel groupinstall development
# Install python3.6
RUN curl https://www.python.org/ftp/python/3.6.1/Python-3.6.1.tar.xz | tar -xJ \
👆 This creates a 138Mb lambda package (35Mb zip). This is not bad, but there are ways to make it lighter 🏋️.
The AWS Lambda environment has some pre-installed python modules like boto3 or botocode that we don’t need to ship with our package (full list of modules). So let’s remove them.
...
...
# We can remove all tests/ script and other unused files
RUN find /tmp/vendored -name "*-info" -type d -exec rm -rdf {} +
RUN find /tmp/vendored -name "tests" -type d -exec rm -rdf {} +
# Here we remove package that will be present in AWS Lambda env
RUN rm -rdf /tmp/vendored/boto3/
RUN rm -rdf /tmp/vendored/botocore/
RUN rm -rdf /tmp/vendored/docutils/
RUN rm -rdf /tmp/vendored/dateutil/
RUN rm -rdf /tmp/vendored/jmespath/
RUN rm -rdf /tmp/vendored/s3transfer/
RUN rm -rdf /tmp/vendored/numpy/doc/
...
...
👆This package will now weigh only 100Mb (28Mb zip).
This is great, we just saved 28% of space, but what if I tell you we can still make it lighter and even make the code run faster?
Magic trick
Python is an interpreted language, meaning that we don’t compile our code before sending our instruction to the machine. That said, Python has a concept of compiled files used mainly to speed up processes.
If you’ve ever written a python script, you may have noticed the presence of .pyc files after running it. Those files are “byte-compiled” copy of the script that’s then sent to python’s virtual machine (source).
Python .pyc files can be a couple of octets lighter.
Because our code is never going to change, we don’t need to provide .py files. We can ship the .pyc files directly, making the package lighter and also speeding up the python runtime (source).
On python3.6, we need to remove all of the .py files and move them from the __pycache__ directories to their top-level parent.
...
...
# Keep byte-code compiled files for faster Lambda startup
RUN find /tmp/vendored -type f -name '*.pyc' | while read f; do n=$(echo $f | sed 's/__pycache__\///' | sed 's/.cpython-36//'); cp $f $n; done;
RUN find /tmp/vendored -type d -a -name '__pycache__' -print0 | xargs -0 rm -rf
RUN find /tmp/vendored -type f -a -name '*.py' -print0 | xargs -0 rm -f
...
...
Adding this 👆, the package now weighs 93Mb (26Mb zip), which is 33% lighter than the initial package 💪.
AWS Lambda Python magic was originally published in Points of interest on Medium, where people are continuing the conversation by highlighting and responding to this story.