Facebook is using Mapbox to bring richer maps to their user experience. We’re helping millions of Facebook users improve the way they meet up with friends, find recommendations, and plan their weekends.
Local search in the Facebook app
We want to deliver the best possible map experience for people on Facebook. We use maps to help people connect with the places they care about. We’re happy to be working with Mapbox to achieve that goal. — Antony Chen, Product Manager, Map Infrastructure
Right now you’ll see new maps in two places: the original Facebook app’s local search feature on Android and the base maps in Facebook Local.
In the main Facebook app on Android, you can use the search feature to find a specific coffee shop, restaurant, bar, event, or see options nearby your current location. Click the Places tab to see your search results on a custom Mapbox map.
With the Local app, you can find interesting events and social spots that your friends have shared or recommended. There are tabs to quickly scan events that are taking place today, this week, or this weekend, so it’s easy to see what your friends are up to.
Local app
Facebook isn’t alone; Snap, Twitter, Lonely Planet, and Woov all use Mapbox to connect your social activity to the world around you.
Facebook 👍 Mapbox was originally published in Points of interest on Medium, where people are continuing the conversation by highlighting and responding to this story.
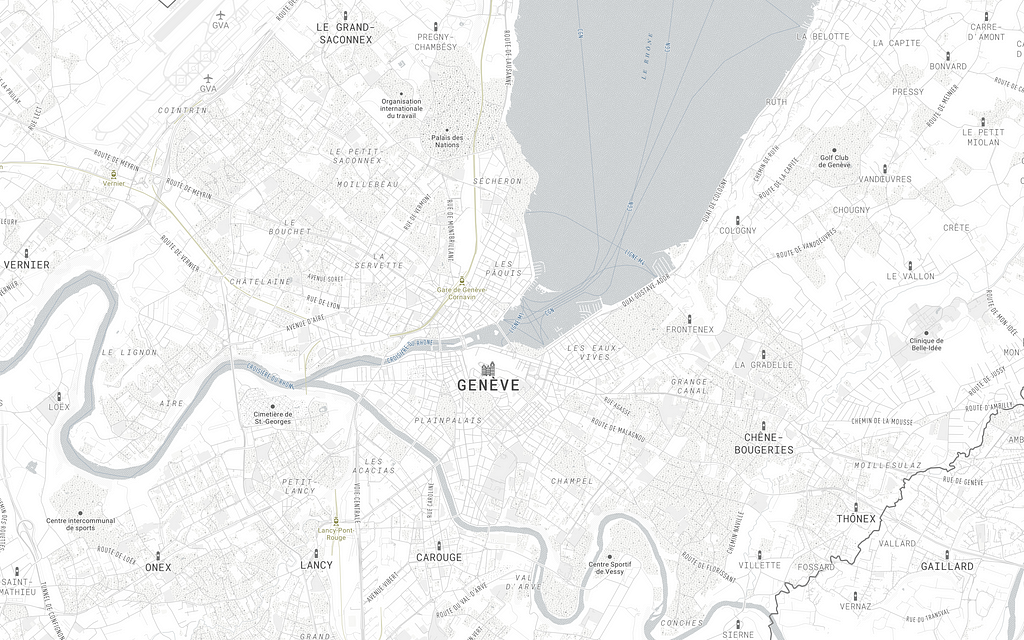
When telling a story or exploring massive sets of information, your data needs to pop on the map.It’s the map’s job to fade into the background, adding just enough context to understand the data. I recently created Minimo, a simple but elegant style designed to do just that, by modifying existing map styles in Studio.
Designing in Studio
From Studio, I started with our Basic map style. I was able to make a highly customized map with just 7 changes, all housed in a highly performant style-sheet with minimal style layers.
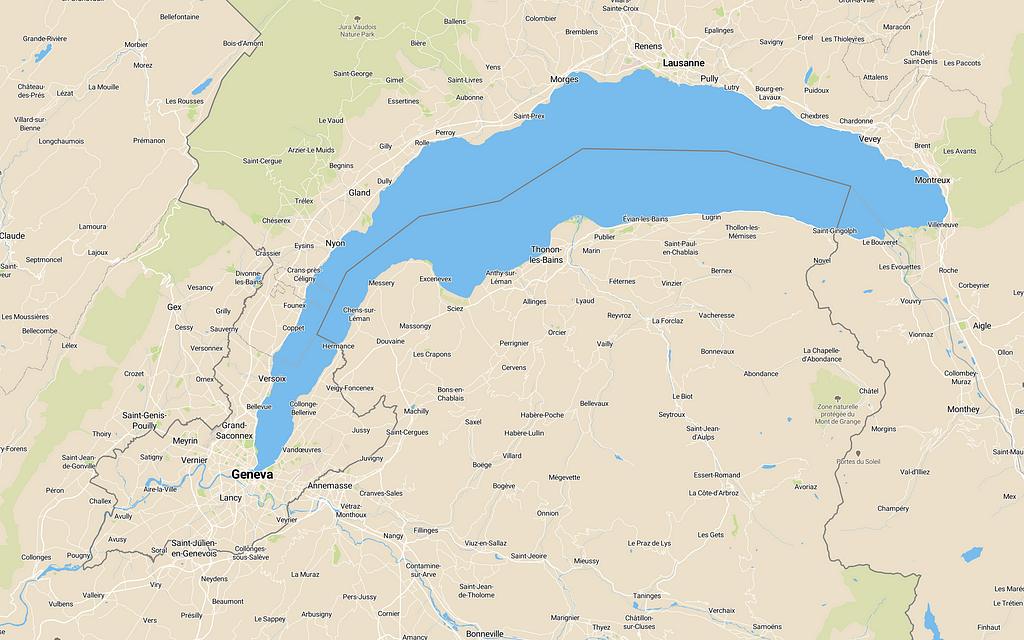
Step 1: Start with the Basic style in Studio
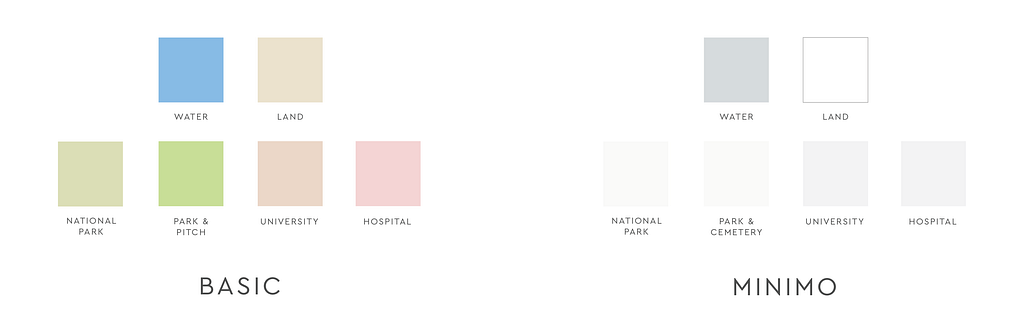
When we start with the Basic style in Studio, we get blue waters and green parks — expected geographic colors for a basemap used out of the box.
I wanted a duo-chromatic map for this new style, so I reduced the color palette to grey-blue scale:
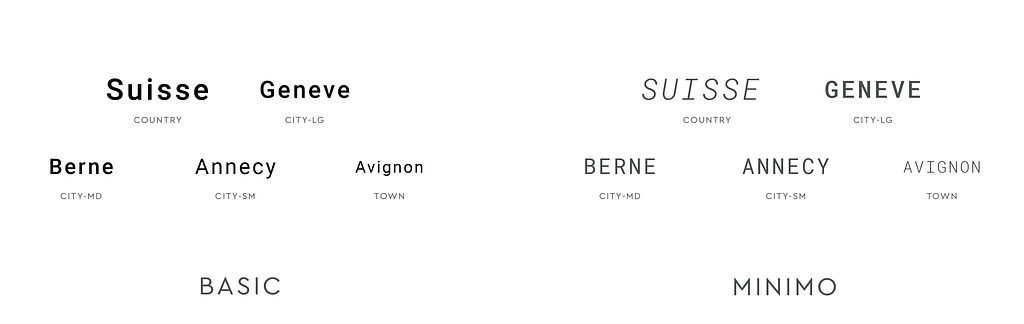
Step 2: Update typefaces and place labels
For a more consistent cap height and overall label weight, I changed the font from Roboto to Roboto Mono and the case to all capital letters. I also adjusted the kerning, emphasis and color to minimize label hierarchy.
Step 3: Add custom building icons
Homogenizing the place label styling provided an opportunity to establish label hierarchy with another map feature: building icons.
Step 4: Add patterns and hill shading
I wanted to add some texture, so I incorporated subtle stippling patterns for water and parks, and a line pattern for hill shading using our recently released terrain-v2 tile-set.
Step 5: Adjust roads and transit
Starting with Basic gave us white roads, so I’ve changed the road color to grey. In addition, I have changed the varying road width — originally styled by road class — and given all roads a single width. I did this so that the base-map could be very minimal, but also so that I could incorporate other modes of transit and give them equal weight as the road network. Lastly, I added subtly colored rail and ferry lines.
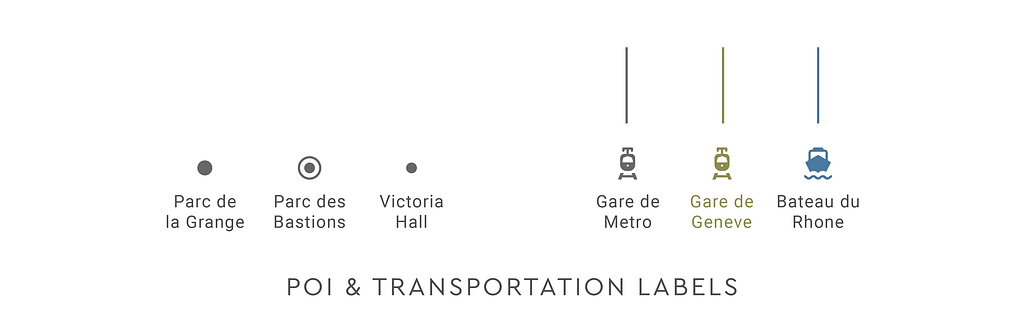
Step 6: Add transportation labels and POI labels
I then styled road, ferry, waterway and water labels, and added ferry and rail station labels and icons. I reduced the level of detail found in the default Maki icons and used more general symbols for three levels of POI labels. This will help the user focus on any data applied to the map, and since I’m already using custom building icons, I want to be conservative with the remaining symbology.
Step 7: Add buildings
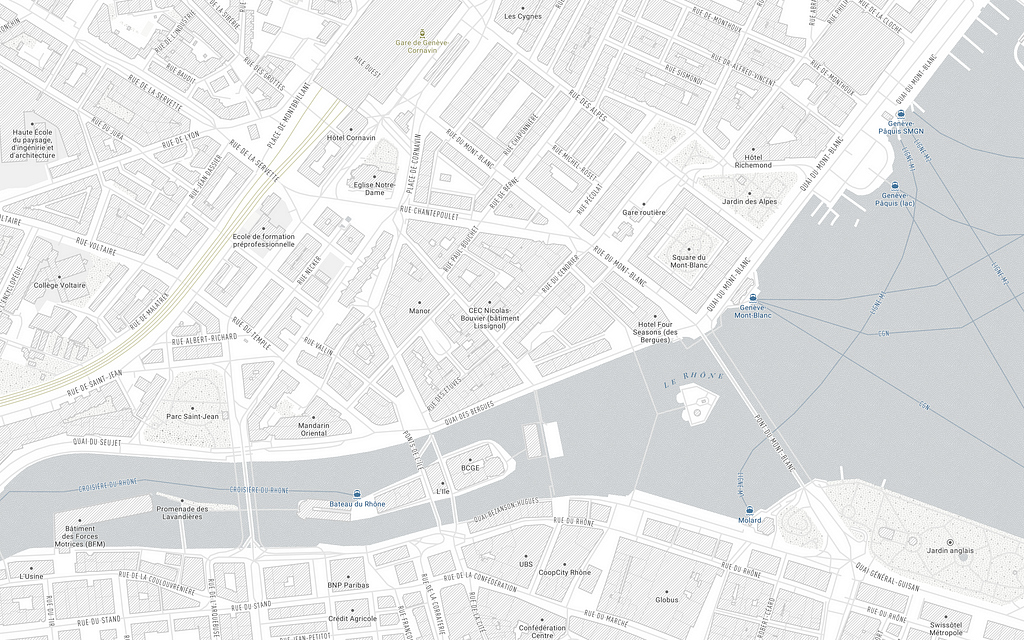
I wanted to use the building geometries to emphasize larger urban forms of towns and cities. To do that, I lightened the color of the road network — up until now, the roads have mostly been showing the urban form — and styled the buildings with a pattern: thin lines to distinguish between individual buildings and thick lines to outline block masses of buildings.
So here’s where I started and what I made with only seven main changes:
Add Minimo to your account to use as is, or customize it to use in your next app or website. If you’re new to Mapbox, sign up to start creating custom maps for your next project.
Looking for another style that works with data visualization? Take a look at Light or Dark.
Making location-based games with our Maps SDK for Unity is now easier than ever. Our friends at Devslopes just released a new developer training course on Udemy: Unity 3D location based-game development with Mapbox. The course features step-by-step video instruction to help you build two location-based AR games using our Maps SDK for Unity.
Take the course and learn how to bring interactive tabletop and world-case AR experiences to life.
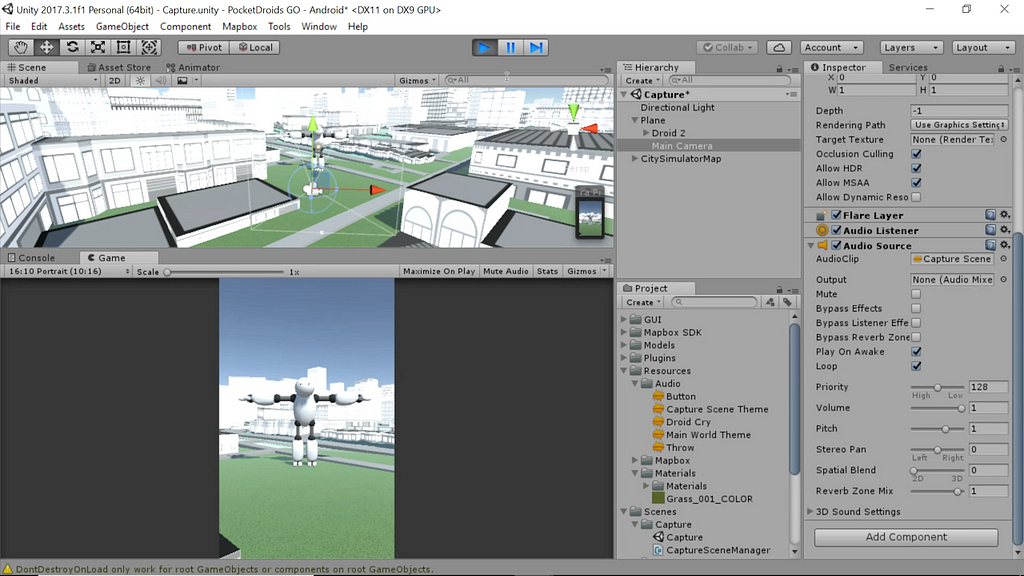
World-scale: PocketDroids GO
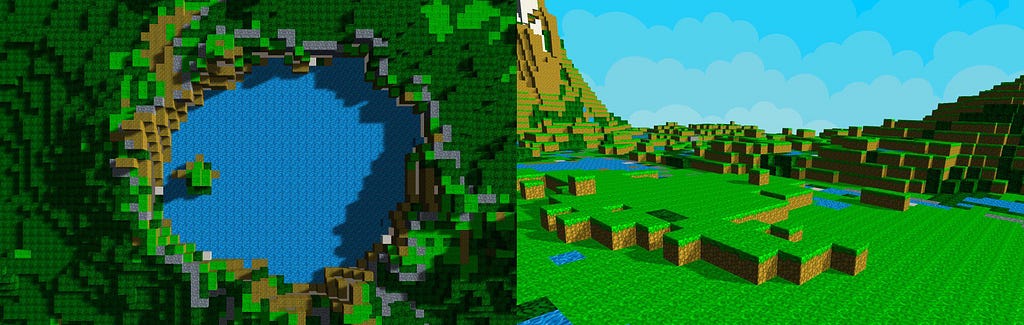
PocketDroids GO is a location-based game that uses your real-world location as a map for a world-scale game around you. To win, you must use an interactive game map on your iOS or Android device, to find and capture rogue robots in your real-world surroundings.
With our Maps SDK for Unity, you can build the game environment without that much programming. We provide the terrain, streets and street names, buildings, parks, and bridges — and Unity renders the game landscape. That means you can focus on customizing gameplay and styling your gamescape with Studio.
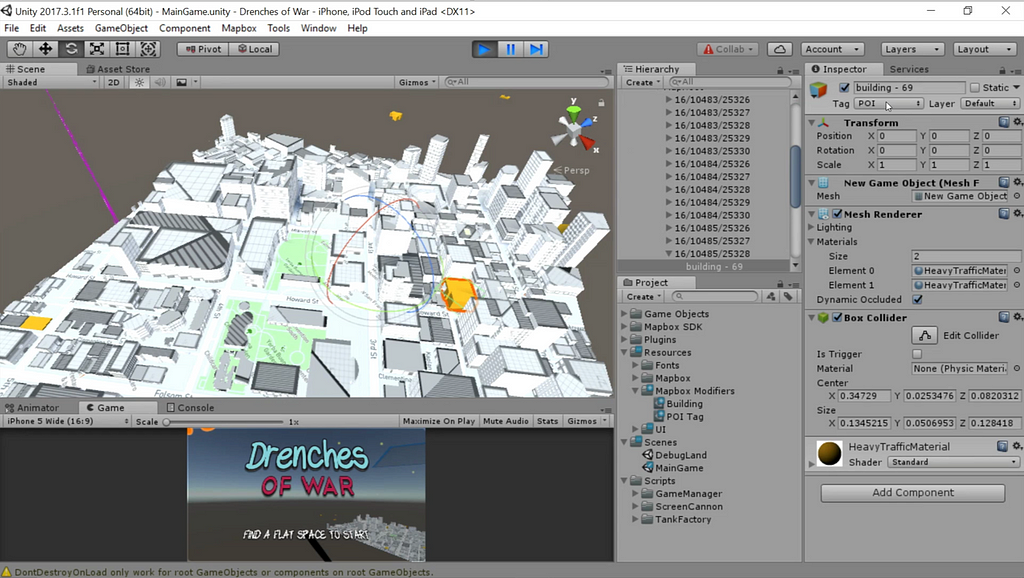
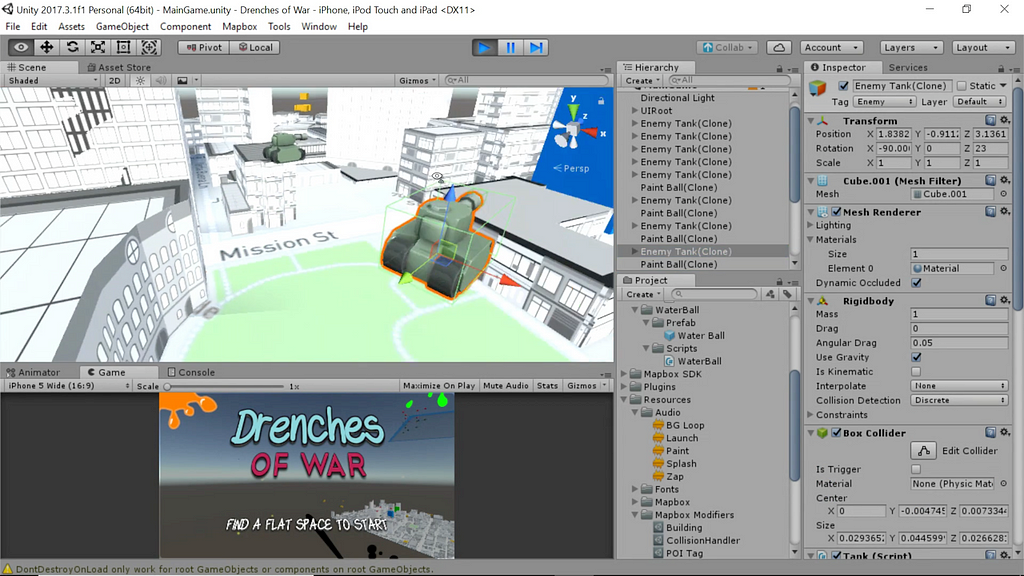
The second tutorial shows you how to build a tabletop AR game called Drenches of War. In this game, you must defend nearby buildings from enemy tanks determined to ruin them with gooey paint. You must launch water balloons at the tanks, or surrender to a future of dripping technicolor.
In Drenches of War, you can choose any location for gameplay. Sitting in Casablanca? Try playing in San Francisco or Madrid. When you play the game on your Android or iOS device, an image of the game landscape will render on your screen, anchored on any tabletop in front of you. You can change the perspective of the scene by walking around the table.
We provide the landscape, so you are free to focus on customizing 3D models and other parts of the game experience. As Devslopes instructor Ben Kimble points out:
Mapbox makes it really easy to get started with AR. They even have a pre-fab that we can just drag onto our scene, and get going with it. I don’t think it could get any easier. And the coolest part is we pull in real map data, which means that in a matter of seconds, we can update our entire world.
Here’s a peek at game development in Unity:
To get started building these games, visit Udemy today and enroll in the course for free!
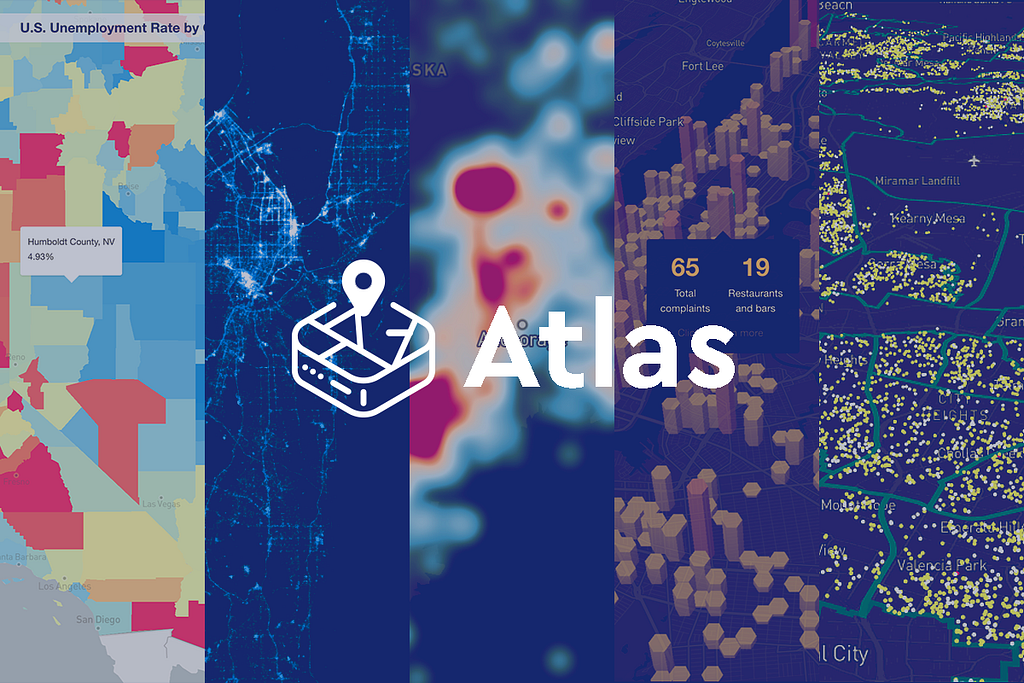
A new version of our on-premises mapping and location platform, Atlas, shipped today — running fully offline on your own secure infrastructure. Atlas comes equipped with our cloud-based mapping APIs but is designed to run fully air-gapped, offline, or behind a firewall. It now comes with vector maps visualizing data at 60fps, our iOS/Android/React Native SDKs, and our design tool, Studio.
This new version includes:
Offline Studio: Build beautiful maps and custom tilesets offline
HTTPS support: Use your own TLS certificates directly in Atlas without a separate proxy server
Docker: Atlas now runs on Docker for easy installation and administration
Atlas is truly all of Mapbox in a box — including our fast vector maps technology, allowing you to render your data at 60 fps. Create custom map styles with Mapbox Studio and then use them to power your on-premises applications running GL JS, our Maps SDKs for iOS and Android, and even our Maps SDK for Unity.
With Atlas, you can use our tools in air-gapped or offline environments and other areas where connectivity isn’t available or desirable. Running offline in disconnected environments is core to our roots; monitoring deforestation in the Congo; tracking malaria to see where to put clinics in Nigeria; using satellite imagery to measure floods in Pakistan.
Atlas is designed to work where you need it including on a virtual private client, bare metal servers in corporate data centers, laptops running with no internet, or even a USB stick. This means that just about every government agency that needs to be FISMA — or DoD RMF — compliant can use Atlas as their on-premises mapping server of choice. And healthcare companies needing to host, maintain, and protect sensitive data regulated by HIPAA can use Atlas to visualize patient trends at scale.
With Atlas, we wanted to give analysts and developers across healthcare, government, and telecom a set of robust tools to visualize and analyze their data. This upgraded version of Atlas simplifies compliance with GDPR, SOC 2, and other regulations. Organizations can build the same fast, customized visualizations they see in the news or on some of the leading business intelligence software easily and securely. — Peter Sirota, Mapbox SVP Engineering
Map your data with our tools, securely. Build telemetry maps, 3D building extrusions, and business intelligence dashboards with Atlas.
Atlas isn’t just offline maps — it’s an offline location platform—andthis is just the first of many planned upgrades for Atlas.
Truck routing is now live in the Directions API, allowing you to specify the weight, height, width, length, axle load, and payload of your vehicle at request time. Based on your specifications, the API will respond with a route that takes the applicable restrictions and clearances into account. Your route will automatically avoid roads where trucks are prohibited and areas that are impassable dependent on vehicle.
With route in hand, you can use the Directions API to generate turn-by-turn directions or the Matrix API to request bulk ETAs to help solve optimization problems.
Getting started with a truck routing request is a simple HTTP request. URLs follow this pattern:
In the configuration above, we’ve requested a route in Downingtown, PA for a typical truck in the US that is 4.11 meters high, 2.6 meters wide, 21.64 meters long, 21.77 metric tons, and has an axle load of 9.07 metric tons.
Making a request with this configuration avoids a well known low-clearance bridge know by locals as “the can opener” because of its tendency to pry off the tops of trucks like the lid of a can and instead sends vehicles on a substantial detour, that takes 12 times longer than the car route. That kind of change has a significant impact on decision-making when optimizing deliveries, and saves users from making costly mistakes.
We’re offering truck routing in beta. During the beta period, we’ll be releasing new features to the API, adding support for the Navigation SDK, and using your feedback and data collected from sources like the Vision SDK to continuously improve our knowledge of truck restrictions, clearances, and weight limits.
Email me at amy.ghate@mapbox.com to get early access to the API and start building.
Truck routing is live was originally published in Points of interest on Medium, where people are continuing the conversation by highlighting and responding to this story.
Aerial imagery company, Spookfish, delivers (stunningly) detailed aerial imagery and analytics to government and enterprise customers. And they use Mapbox to do it. Their specialized multi-sensor capture technique allows them to build detailed 3D models of the land below. When Spookfish was just getting off the ground, the team turned to our Maps API, Geocoding API, and GL JS to quickly deploy their map experience to analysts and developers.
We investigated a number of web mapping libraries but quickly found that most lacked the functionality we required. For example, most libraries still used 2D canvases, and none of them let you quickly and easily iterate on styling vector data — an important requirement for us when it comes to visually representing AI data and other overlays. We also found Mapbox to be an excellent “all-in-one” solution for both mapping and search. — Josh Maisey, Head of Digital at Spookfish
Our Maps API and GL JS allows the Spookfish team to pull fast-loading, detailed basmaps into their platform; while our Geocoding API enables accurate location search in the map.
We’ll be looking to leverage Mapbox’s features to help deliver these 3D and Digital Elevation Model products in the future.
Spookfish packs multiple sensors onto their planes to collect photorealistic, true 3D models of the land below for every survey they fly. These surface and bare-earth elevation models will be updated with every capture, letting analysts detect and measure elevation changes in urban and natural settings.
For more information about Spookfish, please contact Nigel at nigel.conolly@spookfish.com. To learn how Mapbox can help you with your aerial imagery platform, contact our team.
3D models for iconic buildings are now available in the latest release of our Maps SDK for Unity.
Buildings like these are a huge part of a city’s identity and developers looking for authenticity in their city simulations will appreciate how these 3D models seamlessly integrate with procedurally generated buildings.
Add your 3D models along with iconic buildings
With the ReplaceFeatureCollectionModifier, you can pick and choose which iconic building you want to replace or add a list of your own 3D models to replace buildings at any latitude and longitude coordinates you specify.
Presets for common feature layers
Creating common layers is now a one-click operation with layer presets for buildings, roads, land use, and points. With the latest release, we have redesigned the UI so that properties are grouped into the specific functionality they serve. Developers will find it more intuitive and easy to navigate through these sections.
Styling modes
Our prepackaged styles are flexible. Choose from different color palettes for Simple style or add transparency to your Dark, Light style. A brand new style lets you choose your own color and transparency.
Performance improvements and enhanced status report
This release includes performance improvements to reduce garbage collection and memory footprint. We also overhauled our map state reporting to be more robust and deterministic.
In the time it takes you to read this sentence, you could have selected a custom style in Mapbox Studio.
Now look at this image:
Your brain will keep processing this for another 100 milliseconds. In that time, you could have uploaded a dataset in Studio.
Our new video tutorials convert time into learning. What are you doing for the next 90 seconds? Probably nothing as easy as learning data-driven styling in this next video.
Click through the image to view tutorials.
If you’re like me — you learn by watching. That’s why we’re excited to share a few new video tutorials that help you go from no experience to a custom map with data visualization in under 30 minutes.
Huge shoutout to Alli Torban of Data Viz Today for putting together a series of short videos to walk you through everything from learning the layout of Studio to styling your own data layer. Each lesson is broken up into a 2–3 minute video and comes with step-by-step instructions. Take these tutorials for a test drive and show us what you make.
Incidents are now live on the map. With real-time incident coverage in the US, Canada, and Mexico, routing in our Directions API and Navigation SDK will dynamically avoid roads closed by accidents, construction, weather, and other changing conditions on the road, ensuring your users get to their destination quickly and safely.
Route drivers around road closures near city hall.
Live location is a network effect. Every time a developer adds Mapbox to their app we power the maps and locations for all their users — now over 400 million per month. All of these sensors feed back into our live traffic data, helping us create accurate real-time ETAs and route drivers away from congested roads. With the addition of incident data, our ETAs take into account both traffic and the context in which it is occurring. Now, your users will be able to “see” why we’re making a particular route choice and understand if they’re avoiding an accident, a construction closure, or other emerging conditions.
To see incidents and traffic data on the map, use the following style URLs in your latest Mapbox project. We have both day and night styles for two types of navigation maps, all with incident information:
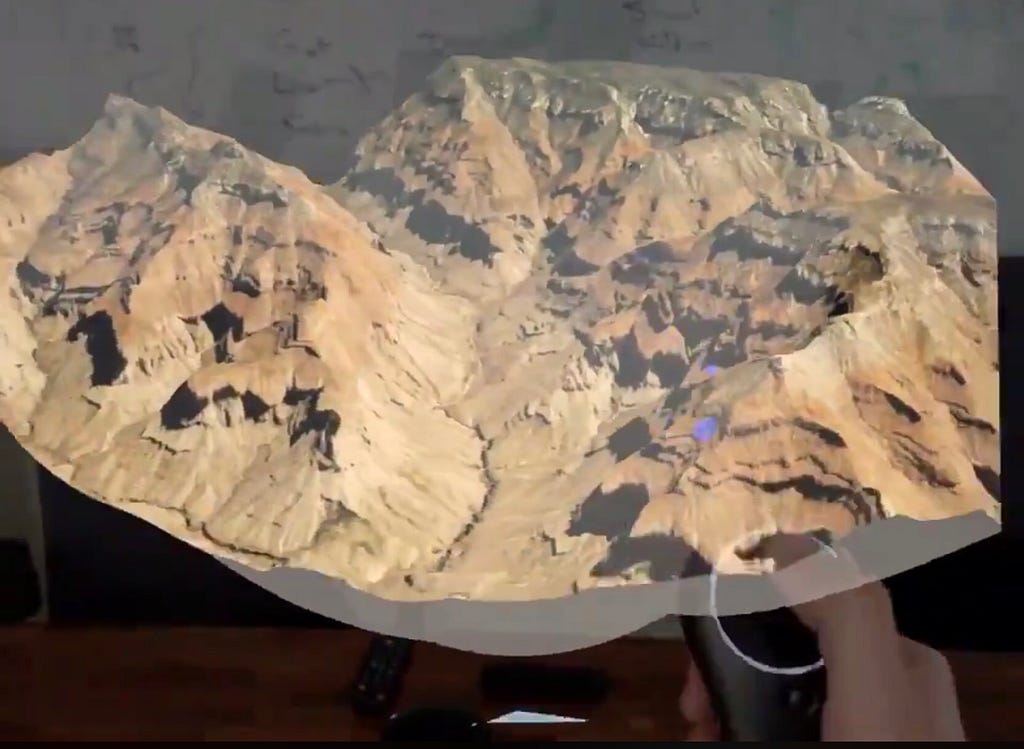
Building for the Magic Leap is straightforward thanks to the tight integration between Lumin OS (Magic Leap’s mixed reality OS) and Unity. Here’s a demonstration of the new “Magic Maps SDK” — RT with #magicmaps.
The mixed reality headset allows for a more emersive experience than any other device we’ve built on thanks to the 6DOF controller, eye tracking, and hand gestures. Magic Leap has a “zero iteration” feature with a live remote to Unity. So when tweaking the size of the map or any other small change, the update appears immediately in the headset. Morgane captured this the best:
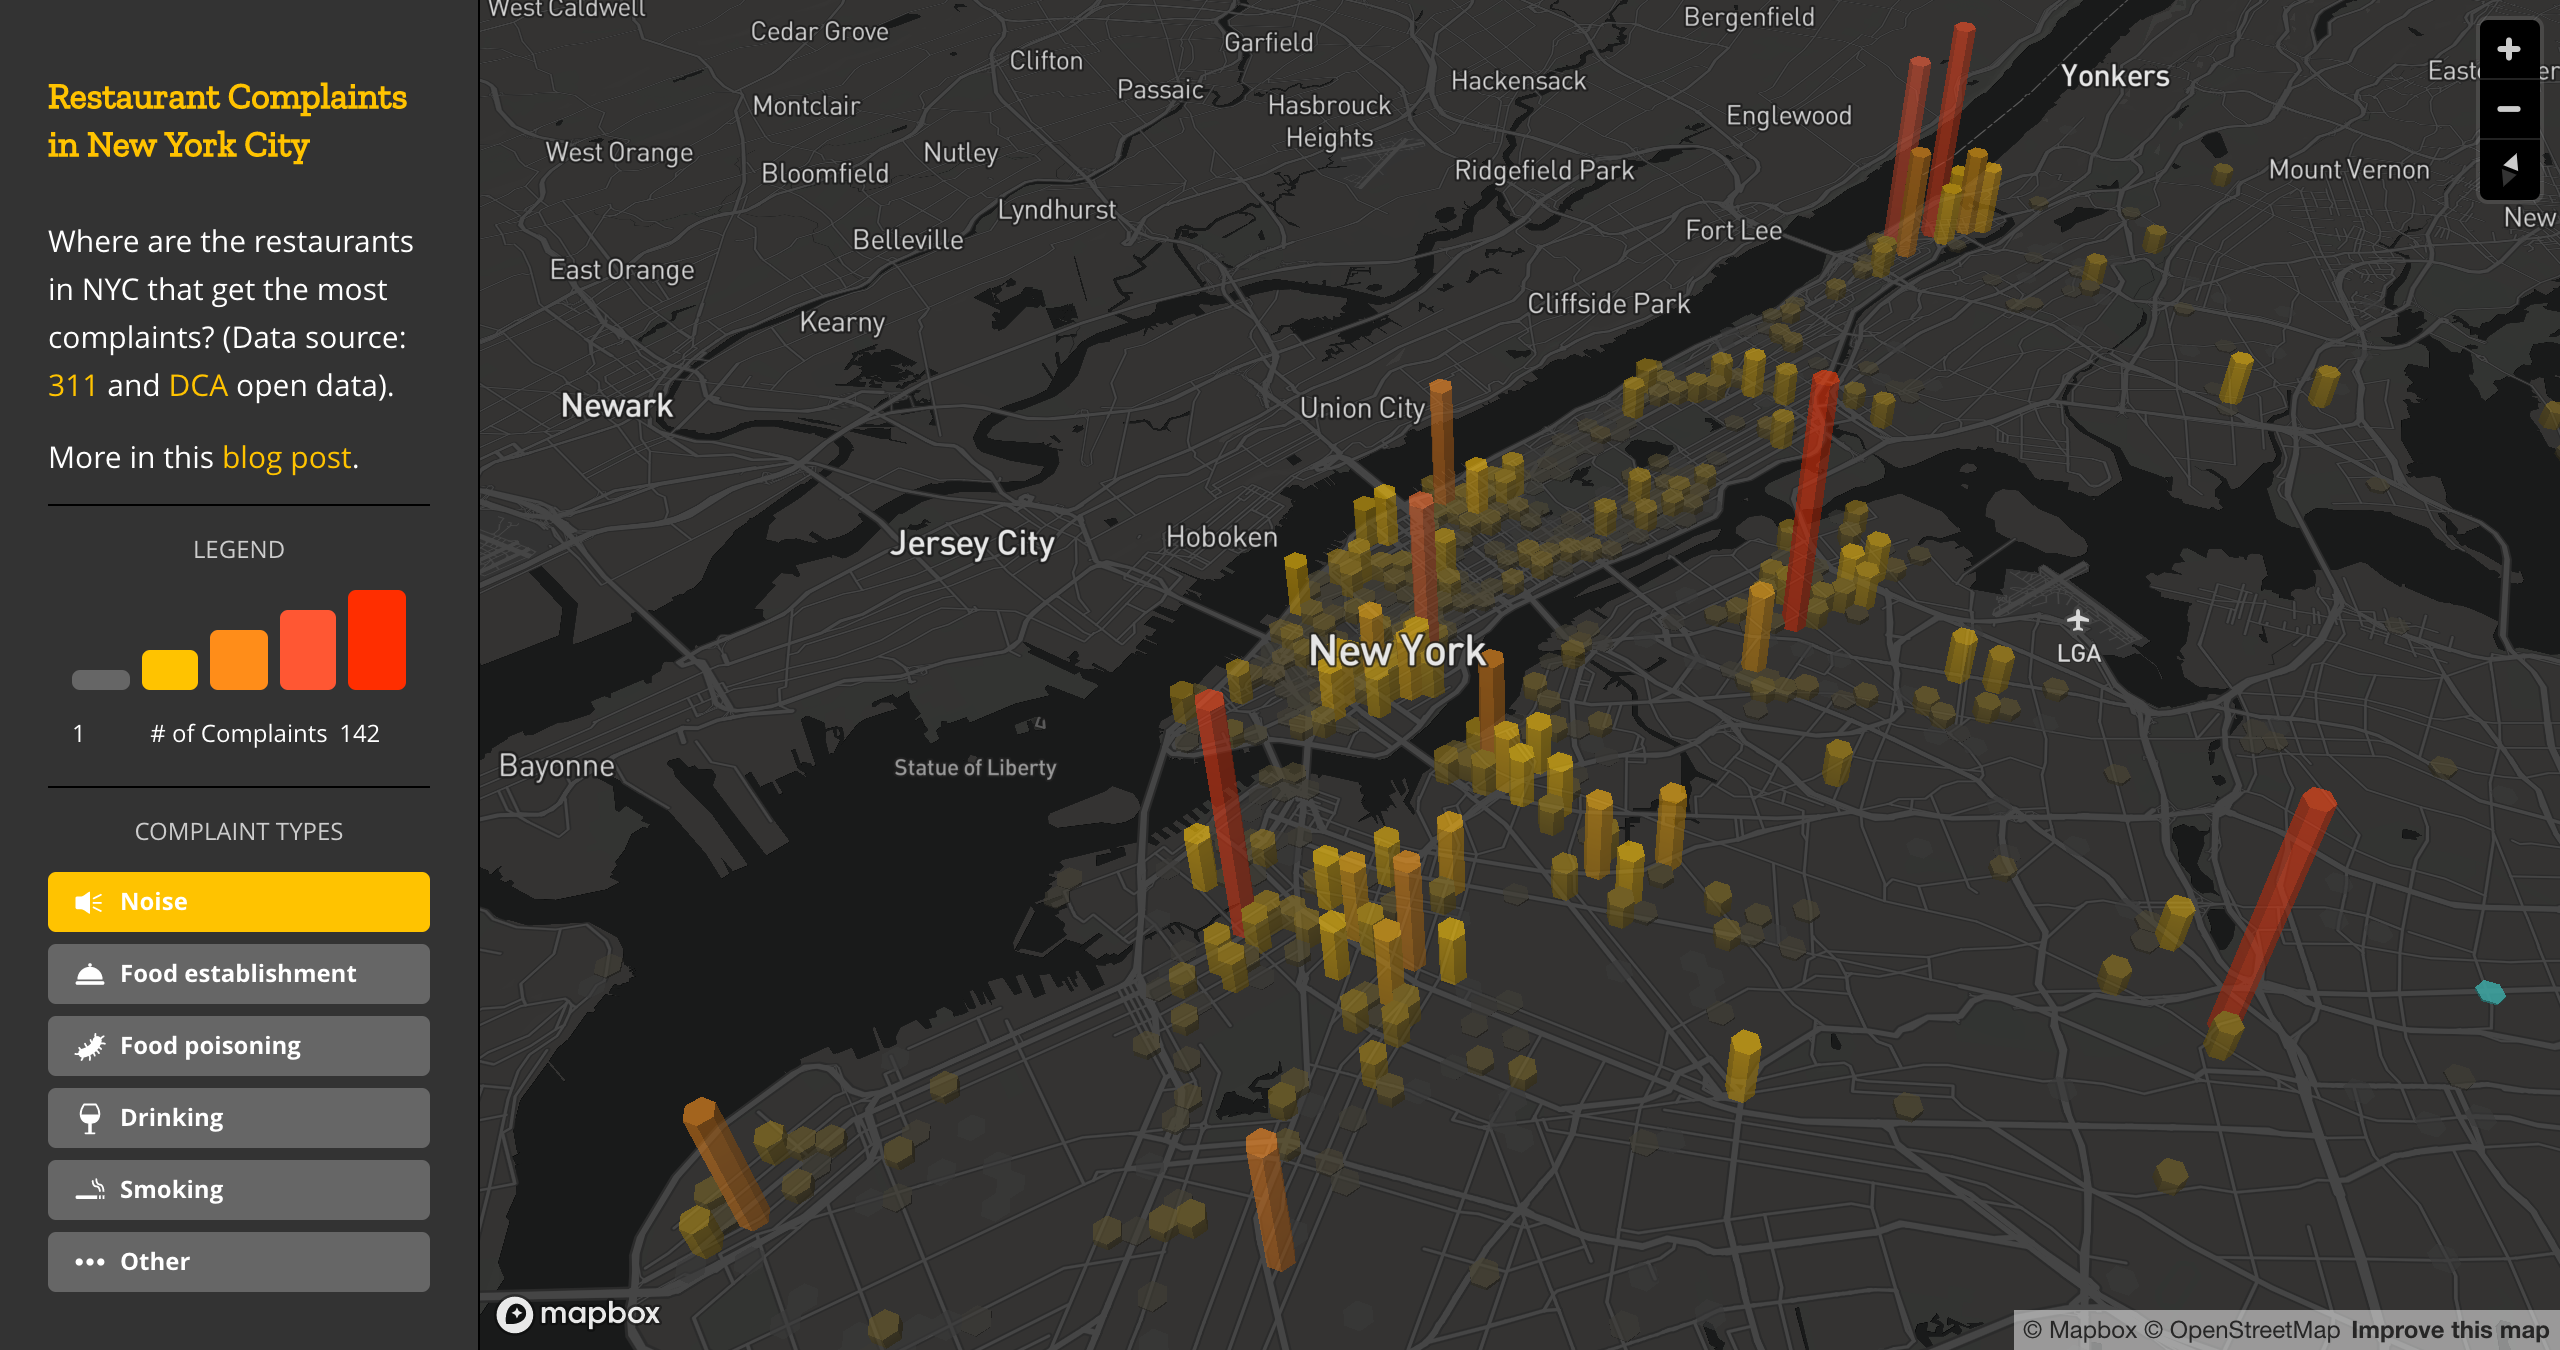
Our friends at Urbica, an urban data analysis and visualization company from Moscow, always blow us away with how they visualize the world around them. They’ve used our tools to explore everything from 3D agglomerations to urban noise mapping. So when we saw their latest creation, AReal, we had to hear more.
Let’s start at the beginning — what is AReal?
AReal is an iOS augmented reality app that shows a map of Saint Petersburg, and it’s landmarks in 3D. There are seven star pins on the map, which mark the locations of Saint Petersburg’s architectural masterpieces. After tapping on a pin, explore the 3D landmarks in augmented reality, play, spin, and scale them. We think it is a fun way to experiment with the environment, placing virtual architecture in real surroundings.
Why did you decide to build this? What was the challenge?
At Urbica, we design and create a good deal of maps and geospatial visualizations, but all of them were flat web maps. At the beginning of 2018 we asked ourselves, why not attempt making a 3D map in augmented reality? After attending Locate, we heard many inspiring talks on maps in augmented reality and location-based AR in general, and as geo enthusiasts, we were challenged to keep up and stay at the forefront.
Take us under the hood — how did you build this?
To build the app, we used Unity and Maps SDK for Unity by Mapbox. First, we created a map style using Mapbox Studio with the initial design, choosing colors and the basic look of the map. Then, we’ve used Maps SDK for Unity to plug the geospatial data and the map style into the 3D environment. Lastly, we made the buildings volumetric and fine-tuned the style inside the Unity tools.
This is your first AR project — do you have anything else planned?
AReal was a daring experiment to explore the possibilities of augmented reality. We might proceed in this field: for example, the idea of visualizing geospatial data in AR excites us. Recently, we’ve even built a prototype using data from our agglomerations.org project:
Apart from AR, we are mostly doing data analysis and visualizations of urban data. We are working on tools which help cities understand their environment better.
I’m building an angry driving directions app that makes fun of you when you miss turns and it’s just about ready. It uses the same technology that the Uber app uses. Does anyone want to be a beta tester?
Billy King is at it again. The developer behind What the Forecast?!!, the #3 daily weather report with varying levels of profanity, is launching an all new app called Back Seat Navigator. Think of it as a very custom version of our Navigation SDK — the app curses you out while you drive and insults you when you make wrong turn. Being stuck in traffic will no longer be boring.
Tell us about your newest release, Back Seat Navigator.
In my new app, Back Seat Navigator, I needed both accurate geocoding and intuitive navigation instructions. Outside of Waze, there is no third-party navigation app, I’m looking to disrupt that space. To do so, I wanted to make driving in traffic more entertaining. I decided to play around with Mapbox’s Navigation SDKs — specifically the voice-guided directions and really enjoyed what I found.
How was it getting started building?
The tutorials for the Map SDKs for iOS and Android are fantastic. In both apps, I was able to get accurate turn-by-turn directions with very little actual code. It allowed me to test out my ideas without having to create entire apps. On iOS, I was up and running with a sample app in less than a day. I just finished working on the Android version and I found development to be just as easy.
Why did you pick Mapbox?
When I started working on What the Forecast?!!, I was part-time and on a budget. I was using Apple Maps on iOS and the Google Locations API on Android. Both were free but had subpar performance. Apple Maps was more suited to finding business locations and is less suited for finding towns and cities. The Google Locations API worked, but my app was hitting the daily free search limits, and the Locations feature would shut off immediately when that happened.
As a single developer, I needed a one-stop solution to continue to scale my app. Since switching, Mapbox spared me the anguish of watching my What The Forecast?!! app fail miserably when Google’s API limits are exceeded; and it’s also decreased the number of furious emails I receive from users. It was only natural I turned to Mapbox again when building Back Seat Navigator.
What’s next for the app?
With What The Forecast?!!, I was keenly aware of how much users like the ability to customize their experience. In Back Seat Navigator, I’m currently only planning to offer the standard Street Maps, initially. In a future version of the app, I’m looking forward to giving users the chance to customize the way the maps look with new and updated map styles.
Back Seat Navigator was originally published in Points of interest on Medium, where people are continuing the conversation by highlighting and responding to this story.
Atlas now ships with Studio. Just like the cloud-based Mapbox Studio you’re used to, you now have complete design control to create beautiful, custom maps — entirely offline and secure.
With Studio in Atlas, you can combine multiple styles into a single basemap, allowing you to use WMTS endpoints to connect other desktop, web, and mobile clients. Custom tilesets in Studio will enable you to add all your vector data into the style itself — giving you fast, performant maps at 60 fps. That means you can even use tools like Tippecanoe to turn 40 GB of GeoJSON into a single 2 GB MBTiles file, letting your explore massive datasets.
Custom map styles aren’t just aesthetically pleasing; they help analysts understand data better. US Government agencies like the FCC use Studio to create a custom styled map to highlight broadband coverage and availability across the United States. USGS custom styles their maps to accentuate live earthquake data. Even NOAA uses the flexibility of Studio to bring data to the top, allowing them to overlay street and city labels on top of live radar data giving them the context they need in a crisis.
Get in touch with our team to find out how you can get started visualizing your datasets securely on-premises with Studio in Atlas.
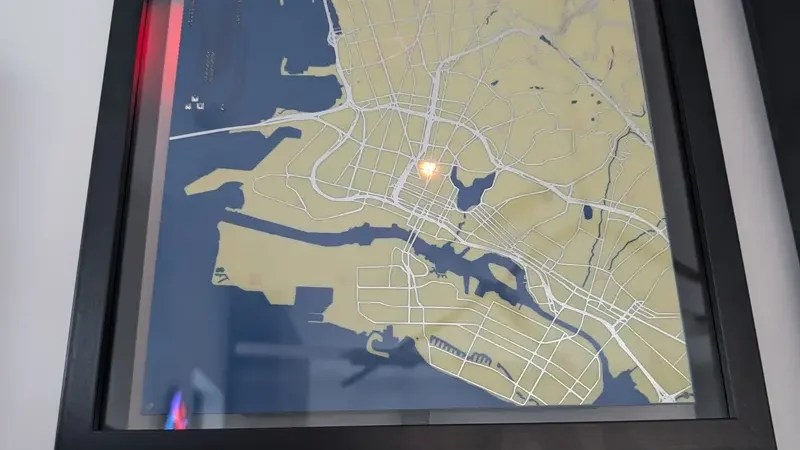
This morning the label over New York City was changed by a malicious contributor via one of our data sources. This hate speech attack is disgusting. Within an hour of discovering the edit, our team deleted and removed it, but the slur was live on our maps.
Hate speech online is intolerable. The internet needs to be safe from hate. Our maps must be safe. Our root cause analysis shows that this malicious attack was immediately detected and put into quarantine for human review. This is where our system failed. While our AI immediately flagged this malicious edit, we experienced a human failure. The micro-tasking system, used for human reviews of suspicious data that is detected from our AI pipeline, has been suspended until we understand why this obvious error was allowed to be overridden and pushed live onto the map.
Our investigation shows this edit to the label of New York City was part of a series of hateful attacks from the same individual. While all other edits from this user were blocked, the New York label edit was mistakenly approved and the AI quarantine was overridden. The malicious contributor responsible is already banned from the platform and we will refer supporting information we have on this and any other hate speech on our platform to the appropriate law enforcement.
Our maps are made from over 130 different sets of data, and we have an AI validation system that reviews all upstream data sources, from satellite imagery to restaurant data we buy to open communities like Wikidata, a global community of data editors; OpenAddresses and local municipalities; Foursquare and a community of local POI enthusiasts; OpenStreetMap and a community of geo-enthusiasts. Groundtruthed data from users on the map is critical.
This is a moment in time in the world where we are compelled to stand, together, against hate. Not just as one company, but together with public and private sector actors to make the internet and our maps a place free from hate and malicious content.
Below is our initial analysis of what took place and our response.
Root Cause Analysis
Mapbox runs a proprietary validation pipeline that reviews all edits from OpenStreetMap and other data sources before they reach the Mapbox map. This pipeline automatically flags suspicious edits, and every single review is approved by at least one human reviewer. On an average day, Mapbox reviews 70,000 map changes and blocks around 50 incidents of vandalism from OpenStreetMap from reaching the Mapbox map.
The process for reviewing map labels begins with an analysis from predictive models trained on known profanity or contentious terms. From here, each review is passed to a human reviewer. Our review tool did mark the label change as significant, since it was a change to a major feature on the map. The review process did not mark the term “Jew” in the edit as an additional risk, given that it is a common word in valid labels.
Mapbox Actions
Mapbox fixed the incident in our map 57 minutes after it was reported by a customer.
Mapbox has verified it is not affected by other offensive acts of vandalism by this user
Mapbox has locked our map update pipeline while we do a full audit of our map validation system, including any manual processes.
Mapbox will be strengthening our process and working directly with our customers on our next actions to prevent attacks from making it to our map.
Timeline of events
Impact
Consumers of Mapbox Streets v7 were exposed to the anti-semitic slur in NYC for a window of 4 hours, beginning at 8/30/2018 8:30 UTC. Due to caching in users devices this issue may persist longer for users that opened a map within that critical window.
Preventing Future Vandalism
Our system design allowed for a human to be a single point of failure. Our next actions are targeted at eliminating any single point of failure with redundant reviews, improving the effectiveness of our reviewers, and improving our metrics to more accurately weight customer impact when defining our internal SLAs.
We will provide concrete details on next actions in the full Root Cause Analysis once completed.
We’re excited to welcome Paige Powers, former Senior Director of Worldwide Distribution & Inside Sales at Extreme Networks, as our new Vice President of Inside Sales.
Paige joins us with years of experience growing and managing Sales Development, Inside Sales, and Account Management teams. At Extreme Networks, she more than doubled the Inside Sales organization and led a distribution team of over 100 distributors worldwide.
Based out of our San Francisco office, Paige will work closely with our SVP of Sales and other sales leaders to a build high-performing inside sales organization. Her leadership, hands-on experience, and focus on maximizing relationships will allow us to build and scale a world-class Inside Sales team globally.
We’re excited to welcome Tina Hubbard, formerly of Bizagi, as our new Director of Sales Development!
Tina comes to us with a long history of building successful enterprise outbound programs and teams, as well as supporting sales with key process roll-outs. She’s been a crucial part of developing the tools, onboarding programs, and playbooks necessary to build a healthy sales pipeline.
Welcome to the team, Tina! We’re looking forward to your leadership.
Mapbox China is expanding! We just opened our Beijing office in the WeWork of Sanlitun, bringing us to three China offices including Shanghai and Hong Kong.
With an office in Beijing, we’re close to many of our top customers and many new startups and able to bring in top talent from local universities. We’re proud to have Tony Sun, Head of Product & Engineering for Asia Pacific, leading this office. Tony comes to us from the world of gaming, where he helped scale and grow a team of 500.
We’re excited for this next step and can’t wait to see you in Beijing!
Mapbox ❤️ Beijing was originally published in Points of interest on Medium, where people are continuing the conversation by highlighting and responding to this story.
In Portugal, a free, open source project is making official fire data more accessible to firefighters, emergency workers, journalists, and the public. Fogos.pt has gained significant traction, receiving as many as a million views a day and half a million unique users a month. We caught up with the creator, João Pina, to learn more.
What’s the backstory on Fogos.pt?
It started with a conversation over dinner, in 2015, with friends who are bombeiros — firefighters — and other emergency responders from the national medical emergency institute. They are good people who work a lot, with low pay and high risk. They were frustrated that in order to get information about fires, they had to go to the civil protection authority website and download PDFs. So I decided to build a website version for them. My goal was to create an easier way to use trustworthy, official data to provide real-time information about the fires to professionals and civilians.
Since then it’s grown over the years, with help from a bunch of contributors on GitHub. In 2016, I released an Android and iOS application, with push notifications alerts for fire outbreaks. With the rising number of users and open source contributors, Fogos.pt is adding more features. That’s the power of an open source community project — the people who use it can build features they need and make them available for everyone. Even just sharing insights on GitHub can inspire great new features.
Where does the data come from?
The fire data comes from open data released by the official authorities in Portugal. I also added data layers for weather like temperature, precipitation, and cloud cover from OpenWeatherMap, which offered to sponsor the project. I was using Google Maps for the basemap, but it became too expensive for a non-commercial project without funding.
How was the move to Mapbox?
The first time I heard about Mapbox was at an event in Oporto for Open Data Day in March this year. Some participants who contribute to OpenStreetMap recommended Mapbox as a basemap and explained how Mapbox supports open source and open data. I then contacted the Community team to ask if they could support this as a non-profit project.
For Fogos.pt, I’ve used Mapbox basemap tiles with Leaflet.js — which I used because it is easier to work with the data from OpenWeatherMap. Mapbox has some very cool and powerful tools — my favorite feature has been the customizability of layers and map controls. All the tools are very user-friendly and the migration from Google Maps was seamless and smooth.
The biggest challenge for a backend developer like me is frontend skills. Open sourcing the project was the solution. People were very generous contributing their work and it became much more user-friendly and accessible — special thanks to my friend Isa Costa, a talented web designer at Bright Pixel, who helped a lot with this.
How’s the map been performing during this year’s fire season?
There’s a lot of traffic that comes from social media — from the map being shared on Twitter and Facebook. The news is increasingly starting to use and promote the map. Phrases about fires are some of the most common web searches in Portugal right now — and Fogos.pt appears there most of the time. There’s also a lot of direct traffic from embassy websites because they list Fogos.pt as a resource to help travelers to stay safe.
The last few months have been the high season for fires in Portugal. Daily traffic has been very high — and increasing. When there are major fires, there’s been upwards of a million map views a day. Last month, there were over 560,000 unique visitors to the webpage alone — a minimum of 6,700 per day. Everything is working without hiccups and the goal is to maintain that.
I’d like to create sibling projects, for example for floods, droughts, and medical emergencies — and maybe try out some other Mapbox tools, like heatmaps. I’m also using Fogos.pt as an opportunity to support a civil education initiative that informs people what to do in case of the fire and what they can do to avoid it, called aldeiasegura — ‘safe village.’
Many people ask me whether Fogos.pt could be available in other countries. There’s a challenge with data access in some countries — not all authorities release fire data as openly and quickly as in Portugal, so it is harder to recreate something like this. And I’m only one — I would like to see more developers in other countries use Fogos.pt to build disaster maps for their communities. A simple map can have such an impact to help others, and working with the open source community can help you bring everything to a whole new level. People want to help.
João Pina is a web developer based in Aveiro, Portugal. If you want to work on disaster maps with open data and Mapbox, get in touch with João and our Community team.
With Atlas, analysts and visualizers across government and enterprise sectors can build powerful data visualizations, all behind their own firewall. Atlas now ships with our cloud-based mapping APIs, our design tool, Studio, and our smooth, fast vector maps, capable of visualizing billions of data points at 60fps.
Here’s a look at our top 5 ways to visualize large datasets in Atlas.
1. Choropleths
Choropleth maps let you style geographical areas based on data values. Use choropleths to view your data across local, administrative, or international boundaries; or in customized regions or markets of interest to you or your analysts.
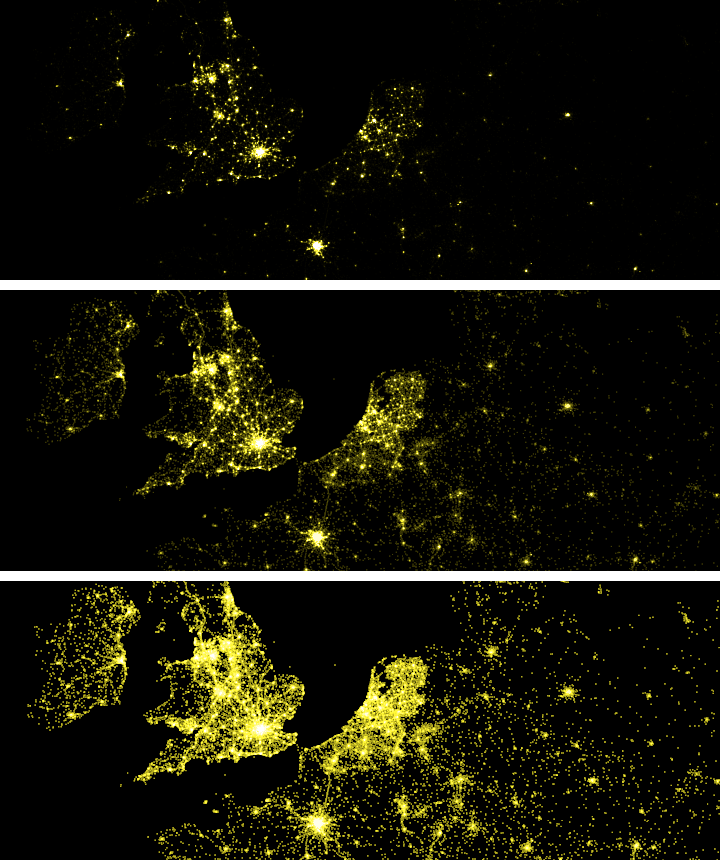
2. Dot Distributions
Dot Distribution visuals communicate density trends in very dense point data. Website traffic, vehicle telemetry, and social media posts all make for incredible dot distribution visuals. Check out Eric Fischer’s tutorial on dot density visualization design to get started.
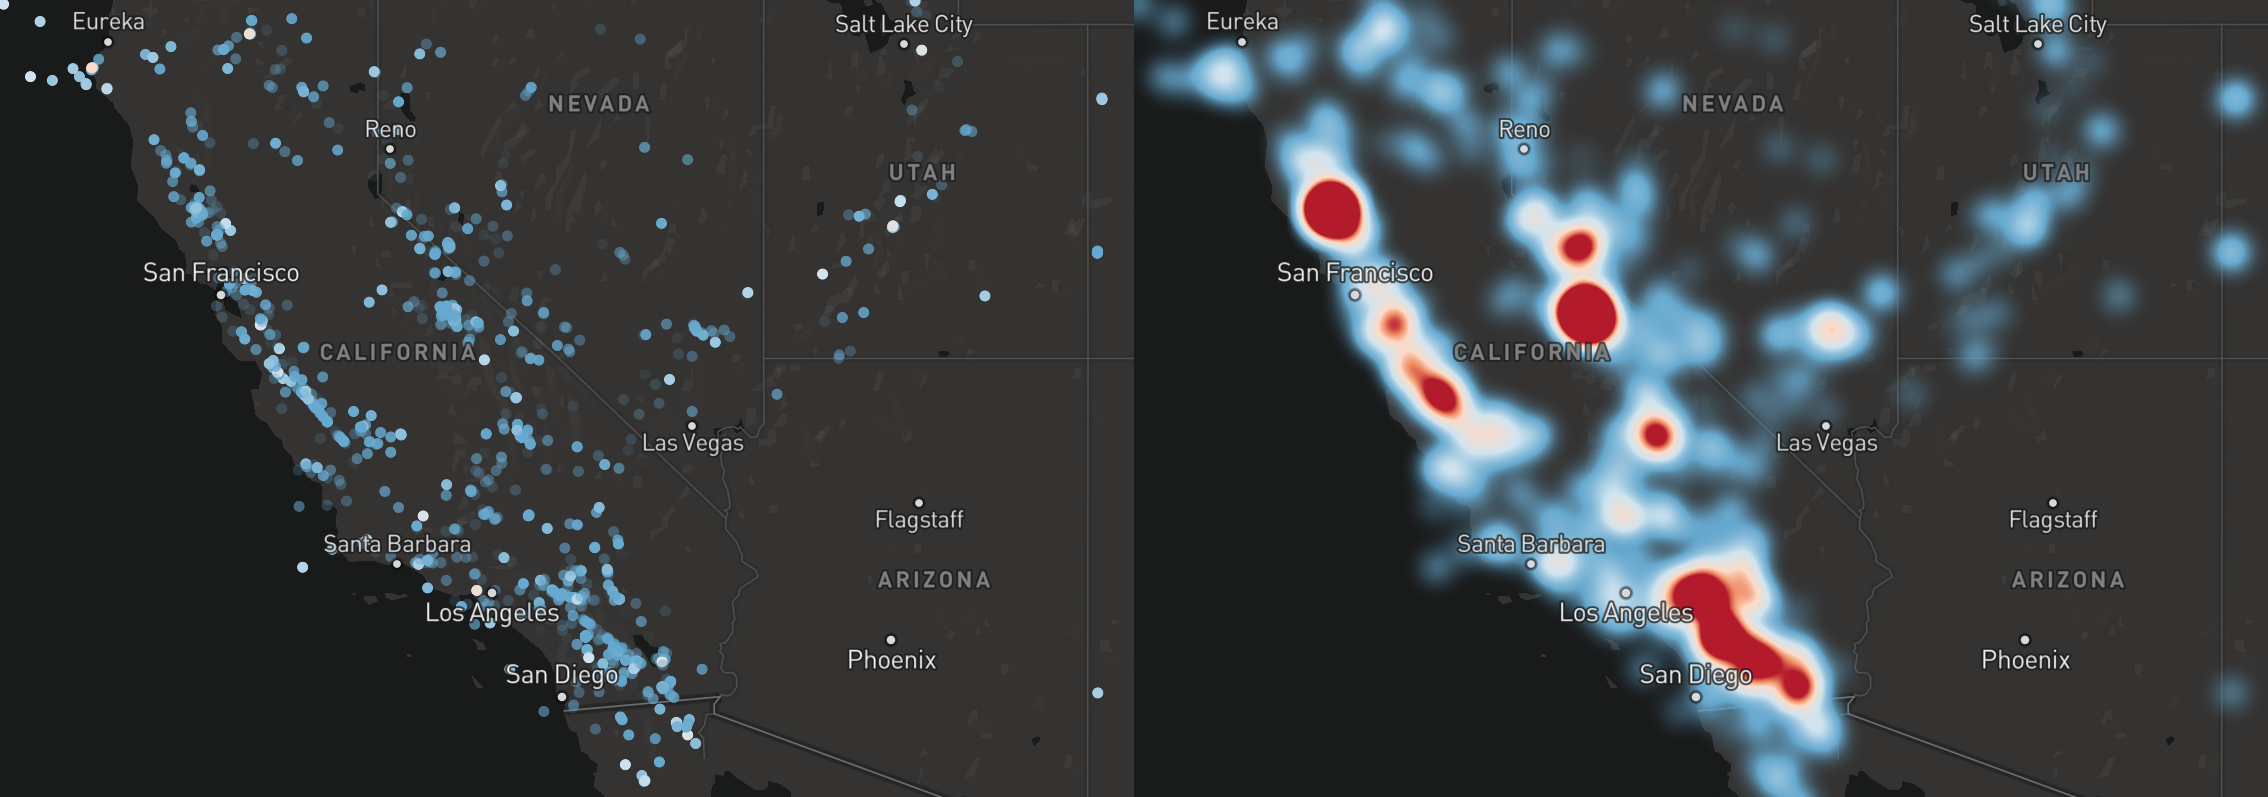
3. Heatmaps
A heatmap is a data visualization where a range of colors represents the density of points in a particular area. The dynamic heatmap layer in Mapbox GL JS renders smoothly at 60 fps while panning and zooming. It’s fast and can handle large amounts of data (especially when combined with clustering).
4. Hexbins + 3D extrusions
Use Hexbins to show general themes over geography. They’re less granular than a dot density map and not constrained by boundaries like choropleth maps. Some visualizers custom-style the color or opacity of a hexbin to represent different data quantity or quality. To kick it up a notch, try transforming your hexbin map with 3D extrusions. These visuals work well when your data has a natural z-element (like elevation), or if you need to compare the relative difference between dense regions, such as the population density of US Census blocks.
5. Animations
Animations let you show how your data changes over a dimension (usually time). For example, you can demonstrate how vehicle event locations have changed over a year (as shown below), or you can visualize the change in unemployment by county over a decade.
With Studio and vector maps now in Atlas, there’s no limit to your data visualizations in the security of your own environment. Find out more, or if you’re ready to start visualizing with Atlas, reach out to our team.
Today, we’re releasing the beta of our Magic Maps SDK for Magic Leap developers. Magic Maps is the first comprehensive toolkit for Magic Leap that lets you add maps and global location data to any game or app.
Get started building your immersive map experience by:
Connect the Magic Leap Creator Edition headset, and make sure it’s on.
Build and Run the MagicLeap Terrain sample scene.
Magic Maps is built on top of the Mapbox platform, meaning you get:
Live location data: Popular location data — determined by anonymized place data aggregated from over 400 million MAUs — allows for gameplay to adjust based on when and where people are present.
3D digital elevation model: A global mesh including real terrain height. This elevation data is tiled into small pieces to make it distributable at scale with low latency around the globe; updates are dynamic.
Points of interest: A geotaggers’ world atlas of locations and categories of the most interesting places and the routes between them in every country around the world, letting app developers interact with millions of real-world businesses and landmarks.
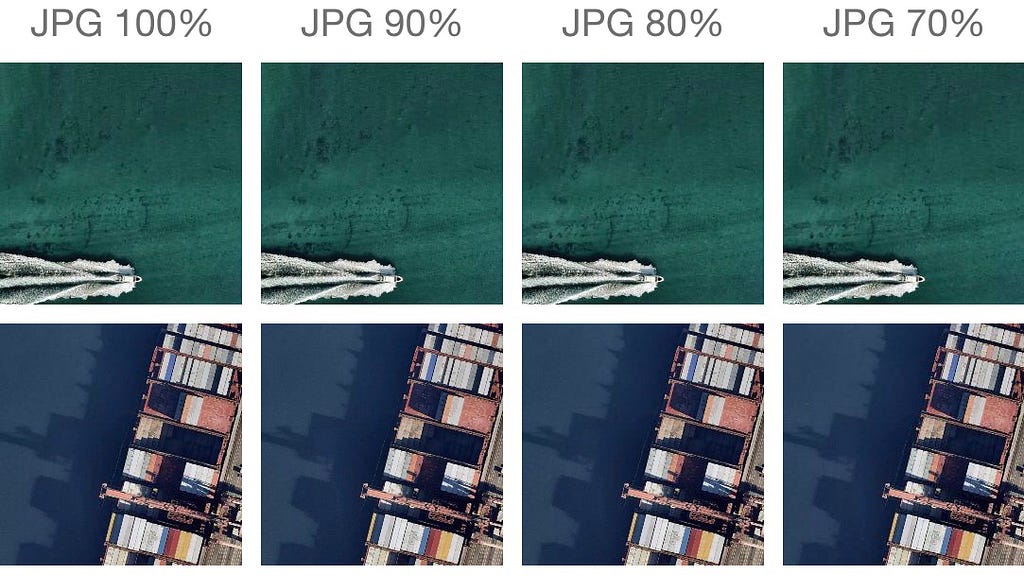
Satellite imagery compression for faster map loading based on bandwidth: Gauge bandwidth by testing the download speed and adjust compression automatically. Developers can specify the level of image compression manually or gauge bandwidth by testing the download speed of a sample tile and adjusting compression automatically.
High-resolution land cover and land use data classification: From NASA satellite imagery to identifying unique land cover classes ranging from parks to beaches to bodies of water to industrial areas, this is data that powers gameplay logic. In addition to the analysis of land classification from satellite imagery, we combine multiple data sources from around the world so we have higher-resolution in places where it’s available. Currently, we have processed:
USGS, 30m resolution, USA including Alaska, Hawaii, and Puerto Rico
GeoBase (combined Canadian gov’t sources), 30m resolution
European Environment Agency, 100m resolution
Geoscience Australia, 300m resolution
NASA MODIS, 500m resolution globally
We’ll grant developer access on a first signup basis — reach out to me at miro.lysyuk@mapbox.com to request access